Introduction
Managing Elasticsearch clusters can be complex at times. As clusters grow, teams often spend significant time troubleshooting performance issues and monitoring cluster health.
Elastic introduced AutoOps to simplify these operational challenges. AutoOps automatically analyzes cluster metrics and provides actionable recommendations, reducing the need for manual intervention
AutoOps in Elastic
AutoOps is an operational monitoring and diagnostic feature that helps you understand what is happening inside your Elasticsearch cluster.
AutoOps evaluates cluster metrics and provides insights in several key areas like :
Root cause analysis: Instead of only showing metrics, AutoOps identifies the actual cause of a problem. This saves engineers from manually correlating multiple metrics and logs.
Performance recommendations: AutoOps provides clear suggestions for resolving issues, such as:
- Fixing shard imbalances
- Optimizing mappings
- Improving indexing pipelines
- Adjusting cluster settings
These recommendations are practical and easy to implement.
Configuration issues: Flags settings that may affect performance
Reduced Operational Overhead: Because analysis is handled in Elastic Cloud, AutoOps eliminates the need for additional monitoring infrastructure. Engineers can focus on resolving issues instead of building dashboards or maintaining monitoring tools.
Resource utilization problems: Highlights bottlenecks in memory, CPU and disk usage. This helps teams detect issues proactively before they impact cluster performance or availability.
How to setup AutoOps in your self managed environment
Here’s how you connect a self‑managed Elasticsearch cluster to Elastic AutoOps quickly.
The following section provides details on how to set up Elastic AutoOps in your local environment:
1. Log in to Elastic Cloud
First, go to Elastic Cloud and log in to your account. If you don’t have one, you can create it for free at cloud.elastic.co.

- Once logged in, go to the cloud management page

- Navigate to Connected Clusters.
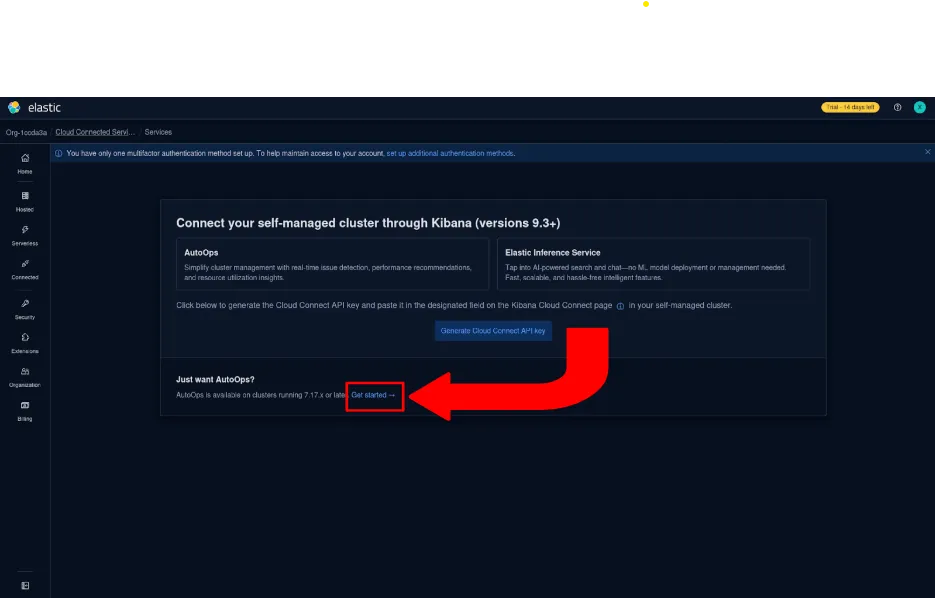
- Notice that it says “Just want AutoOps?” click on “Get started”
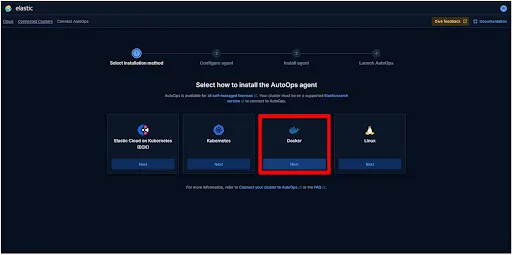
2. Choose how to run the agent
Decide where you want to run the connection agent. You can choose from Kubernetes, Elastic Cloud on Kubernetes (ECK), Docker, or Linux. I have a windows system, so I chose Docker.
3. Enter your cluster’s URL
In the setup wizard, type the web address (URL) of your self‑managed Elasticsearch cluster, I chose http://host.docker.internal:9200 since I chose Docker for deployment of the AutoOps agent, you can add the URL of your deployment (Kubernetes, Elastic Cloud on Kubernetes (ECK), Docker, or Linux) and choose the authentication method, whether you want to use your self managed cluster’s API or username and password.
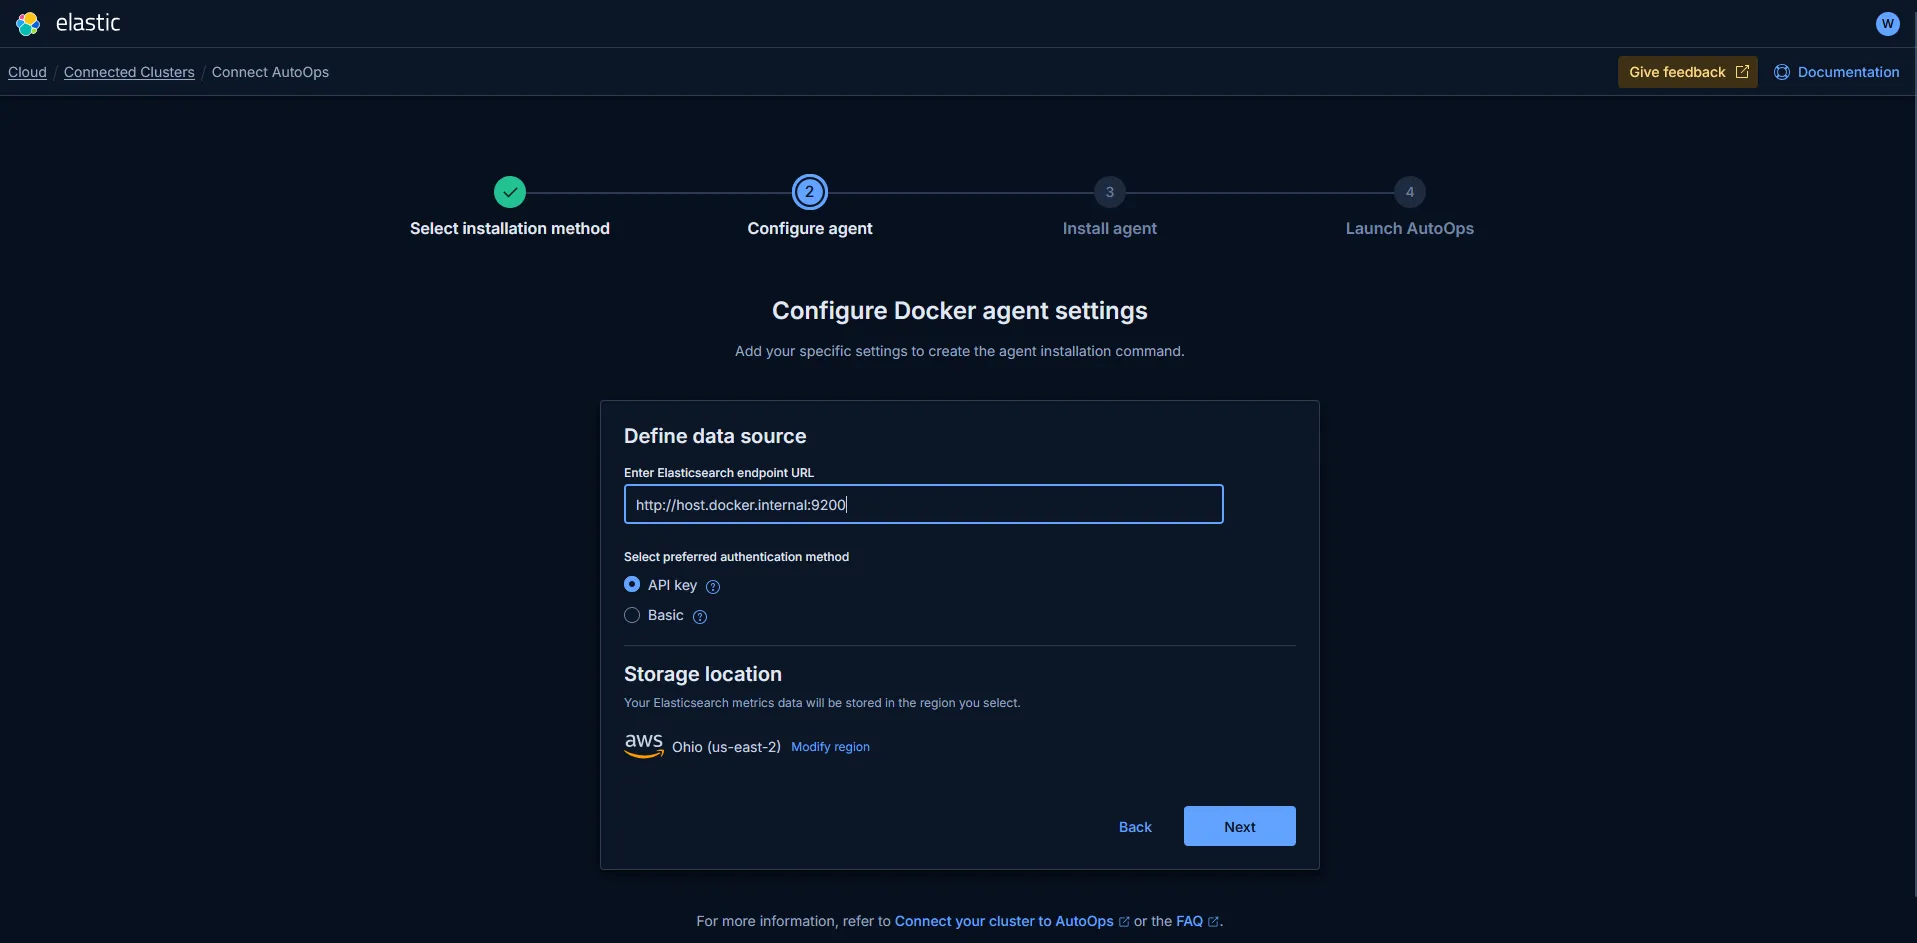
I chose API key for authentication, keep in mind to add it to the compose.yaml
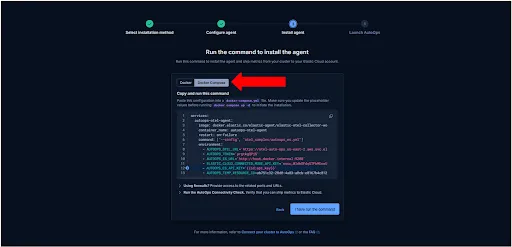
4. Run the install command
The wizard gives you a simple install command. Copy and run it where your cluster can reach it. This installs a lightweight agent that sends metrics (not data) to AutoOps.
5. Create the Docker Compose file
Copy the command from the wizard to a file, and save that file where you have saved your ELK cluster.
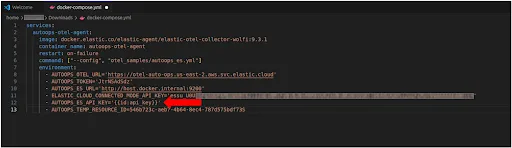
Add your self managed Elasticsearch API key in AUTOOPS_ES_API_KEY
After these steps, click on “I have run the command”

And it will wait for metrics to be collected and your cluster will be connected.
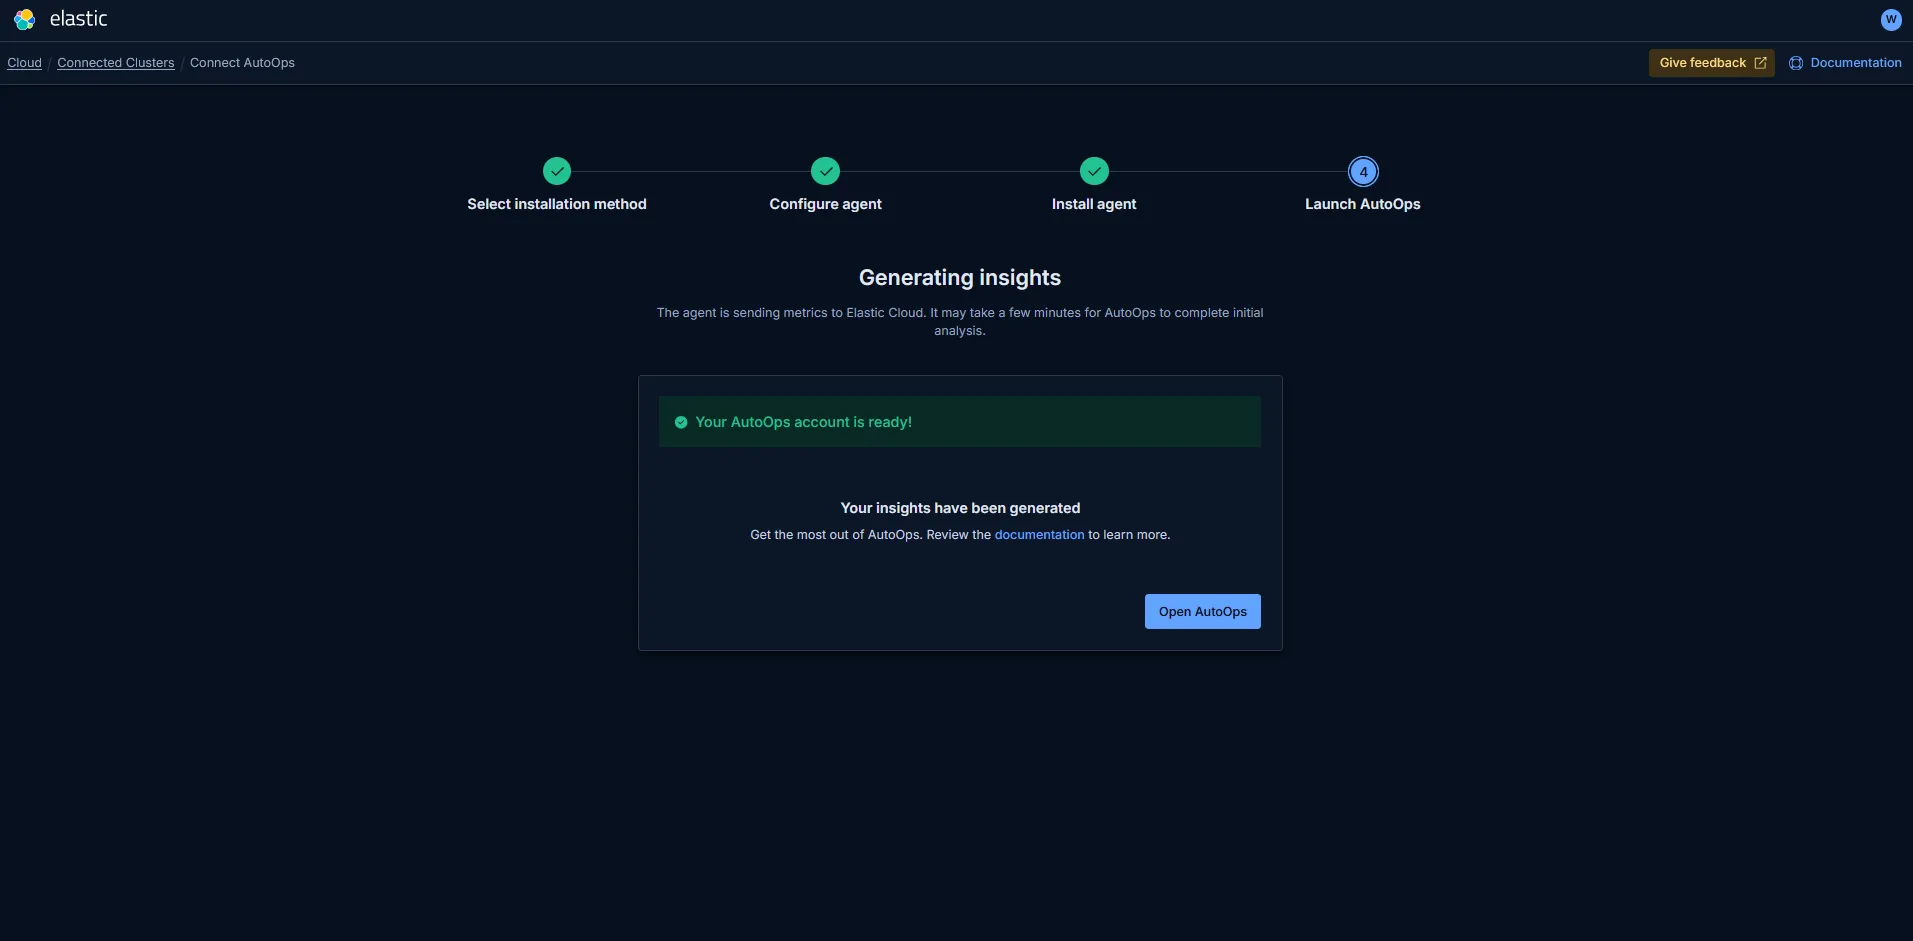
AutoOps will start showing insights in a few minutes.
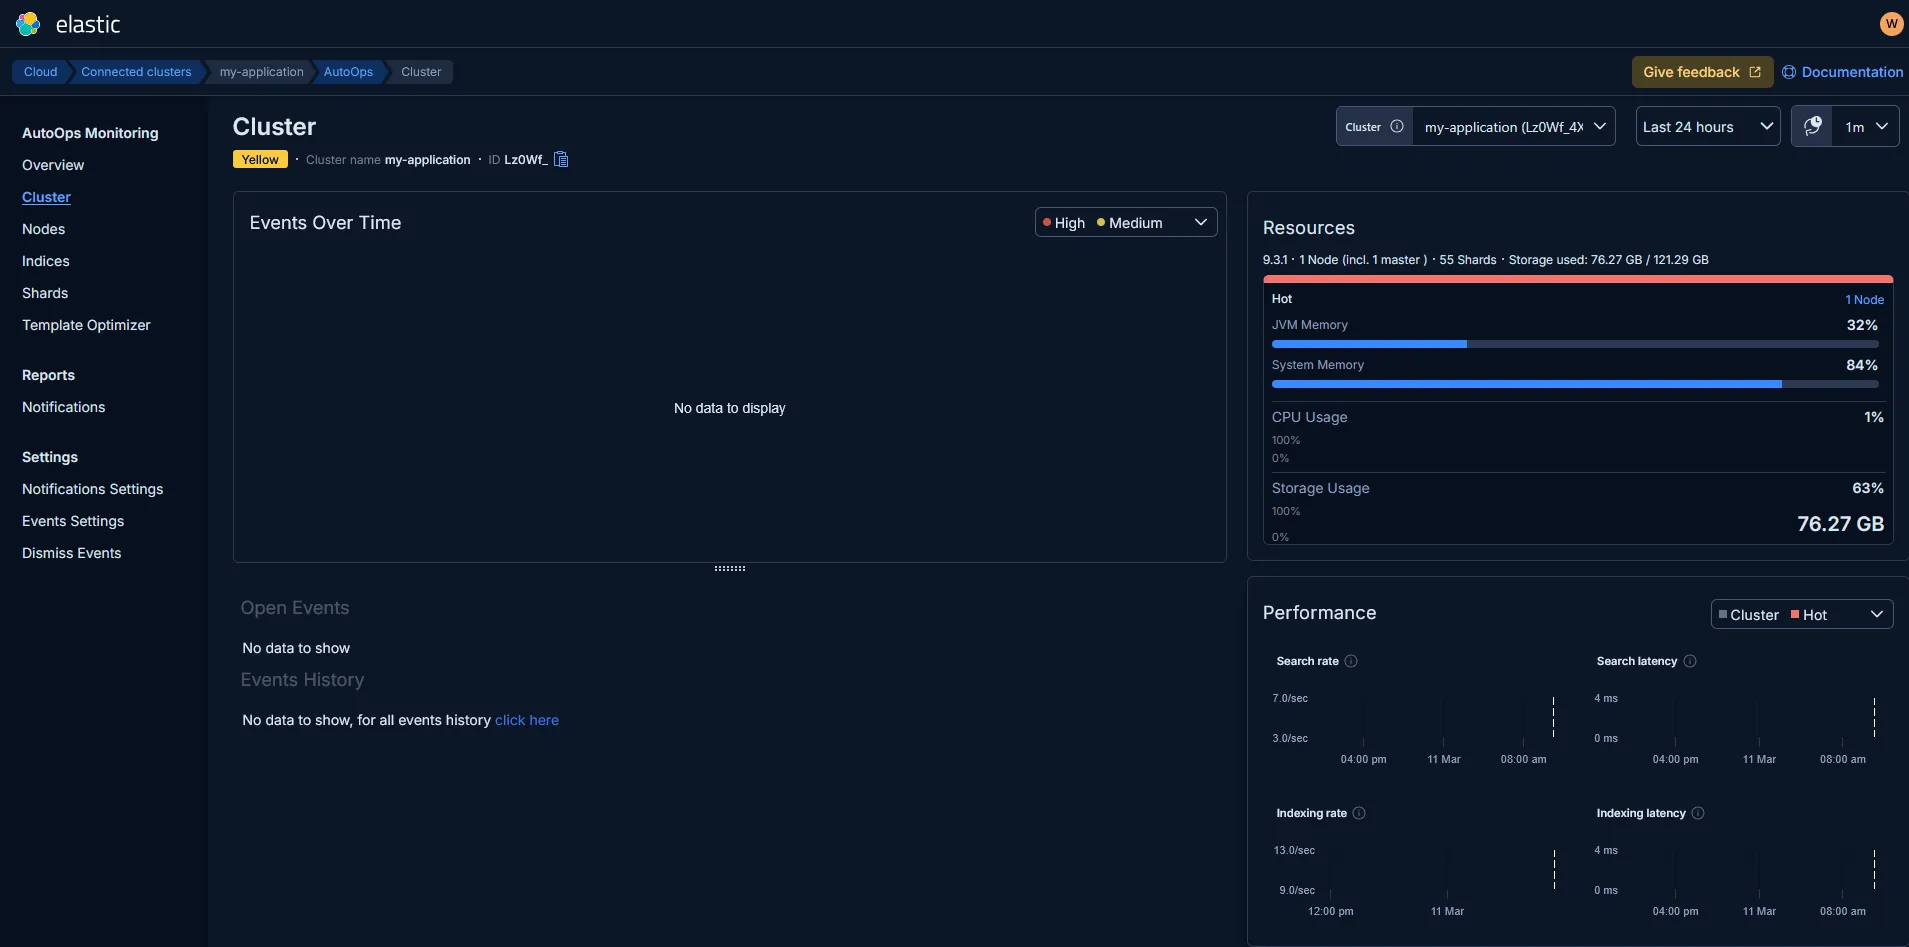
NOTE: No events are visible since this is a fresh cluster
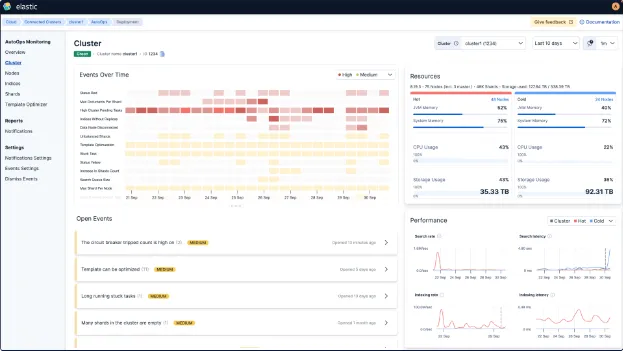
An Elastic Stack with daily alerts and automated reporting provides not only a more elaborate and visually intuitive dashboard, but also enables a deeper and more comprehensive root cause analysis. By consistently aggregating and analyzing data, it allows teams to identify patterns, detect anomalies, and correlate events across multiple sources with greater accuracy. This level of observability ensures faster troubleshooting, improved decision-making, and a clearer understanding of system behavior over time, as illustrated in the example shown below.
Conclusion
Connecting your self-managed Elasticsearch cluster to AutoOps gives users clear visibility into cluster performance without the need to manually analyze logs or metrics. It automatically monitors health, resource usage, query performance, and shard distribution, while providing recommendations to fix issues quickly. For Elastic users, this means faster troubleshooting and less time spent guessing what’s wrong. By relying on AutoOps, teams can focus more on building applications and less on maintaining infrastructure, making Elasticsearch cluster management simpler and more efficient for everyone.