

Elastic 9.5: What the Latest Elasticsearch Release Means for Search, Observability, AI, and Security

Introduction
Elastic 9.5 is now generally available, and this release is less about adding isolated features and more about removing friction from some of the hardest Elasticsearch workloads.
Released on August 4, 2026, Elastic 9.5 introduces major updates across Elasticsearch, Elastic Observability, Elastic Security, Kibana, vector search, and AI-powered workflows. The headline additions include Columnar Mode, VectorDB index mode, automatic vector search calibration, native PromQL support, stronger Agent Builder capabilities, and AI-assisted security alert triage.
For organizations already running Elastic, several of these changes could affect how they approach storage, metrics, AI applications, dashboards, and SOC operations.
Here is what matters in Elastic 9.5 and where the practical value lies.
What Is New in Elastic 9.5?
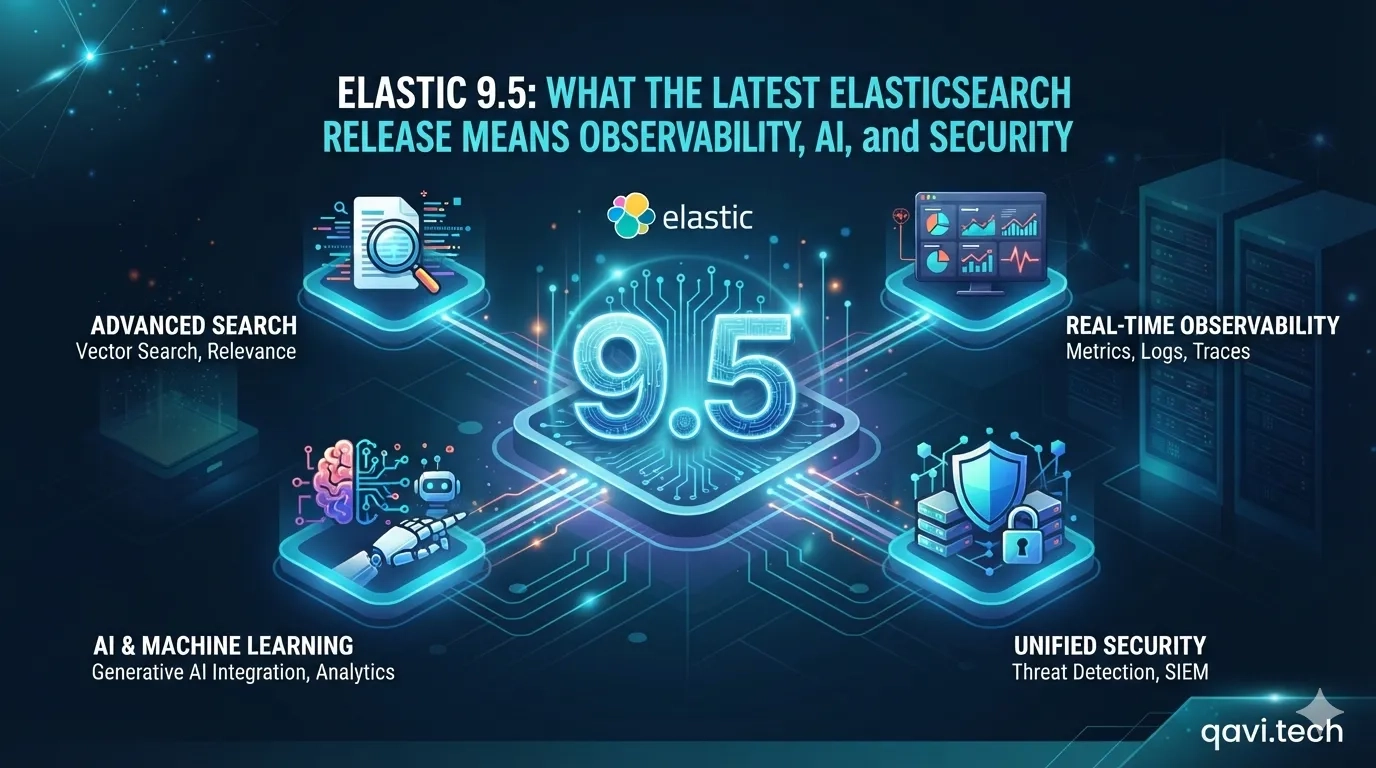
Elastic 9.5 focuses on five broad areas:
- More storage-efficient Elasticsearch workloads through Columnar Mode
- Easier production vector search with VectorDB index mode and auto-calibration
- Better AI agent development, monitoring, and governance
- Native Prometheus and PromQL support for observability teams
- More automated security investigation and alert triage
There are also significant improvements to Kibana dashboards, Elastic Workflows, Kubernetes monitoring, cloud integrations, APM, LLM observability, and endpoint security.
Columnar Mode Brings a Different Storage Model to Elasticsearch
One of the most technically important additions is Columnar Mode, currently available as a technical preview.
Traditional Elasticsearch workloads depend heavily on inverted indexes, which make full-text search extremely effective but are not necessarily the ideal storage structure for every type of data.
Columnar Mode introduces an opt-in approach that stores each field once in a column store and does not create an inverted index by default. Elastic says this can provide a smaller storage footprint while creating a foundation for faster indexing, analytical queries, and longer retention periods.
Importantly, Elastic designed the feature to work alongside existing index modes without requiring changes to APIs, dashboards, or integrations.
Columnar Logs
Elastic is also introducing Columnar Logs, a specialized profile designed specifically for log workloads.
Instead of eliminating inverted indexing completely, Columnar Logs retains an inverted index for the message field while storing the remaining data in columnar form.
That makes sense for logs. Engineers still need fast full-text searches against messages, but many of the surrounding fields are more commonly filtered, aggregated, or analyzed.
Both Columnar Mode and Columnar Logs are opt-in, so existing indices are not automatically changed.
For organizations storing enormous volumes of logs, this is a development worth watching closely.
VectorDB Index Mode Makes Vector Search Easier to Operate
Vector databases have become central to semantic search, RAG applications, recommendation systems, and AI agents.
The problem is that production vector search still involves considerable tuning.
Elastic 9.5 introduces VectorDB index mode, which aims to reduce that work. A single setting applies defaults optimized for vector workloads, including settings around quantization, merge policy, and cache loading.
The practical goal is straightforward: developers should be able to get good vector search performance without becoming experts in every underlying index parameter.
That becomes increasingly important as Elasticsearch is used as the retrieval layer behind production AI applications.
DiskBBQ Vector Search Gets Auto-Calibration
Elastic is taking automation another step further with auto-calibration for DiskBBQ vector search.
Instead of requiring engineers to manually determine parameters such as quantization depth, preconditioning, and oversampling, Elasticsearch can analyze the vectors stored in an index and configure these parameters automatically.
For AI teams, this could remove a surprisingly expensive part of deploying vector search.
Manual tuning is manageable during experimentation. It becomes considerably harder when an organization operates many indexes, embedding models, datasets, and applications at production scale.
Auto-calibration moves some of that optimization responsibility back into the platform.
Multimodal Semantic Search Gets Simpler
Search is also becoming less text-centric.
Elastic 9.5 introduces improvements aimed at making multimodal semantic search, particularly image search, easier to implement.
Normally, developers need to create embeddings, process images during ingestion, embed queries, store the resulting vectors, and connect the different pieces into a search workflow.
Elastic's new semantic field simplifies much of this process so that developers can work with image search in a way closer to how they already use semantic_text.
This matters for applications such as:
- Ecommerce visual search
- Digital asset management
- Media libraries
- Product discovery
- Enterprise knowledge systems
- AI assistants working across different content formats
Elastic is clearly positioning Elasticsearch as more than a traditional text search engine. It increasingly acts as a retrieval layer for AI systems working across multiple types of enterprise data.
Agent Builder Gets Observability and Human Approval Controls
As companies move AI agents from prototypes into production, the problem changes.
Building an agent is only the first step. Teams also need to understand what it did, which tools it called, what the underlying model generated, and whether sensitive actions should have been executed.
Elastic 9.5 introduces Agent Observability and Monitoring in technical preview.
The capability can trace LLM calls, tool invocations, and reasoning steps as OpenTelemetry data stored in Elasticsearch.
Elastic is also expanding human-in-the-loop approvals.
Sensitive actions can be held for human approval, with decisions recorded in an audit trail. This is particularly relevant for enterprises where an AI agent may interact with operational, security, or business-critical systems.
Developers can also describe a skill, query, or workflow through chat and have Agent Builder create and save the configuration.
The direction is clear: Elastic wants AI agents to be both easier to build and easier to govern.
Kibana Moves Further Toward AI-Native Analytics
Kibana also receives substantial updates in Elastic 9.5.
The Dashboards & Visualizations API is now generally available, giving teams a supported way to create, update, and manage dashboards programmatically. Dashboards in chat is also GA.
This is particularly useful for organizations managing large numbers of environments where manually maintaining dashboards becomes difficult.
Elastic 9.5 also introduces a Fast Mode option for supported STATS-based queries in Dashboards and Discover.
Instead of scanning the complete dataset, Fast Mode can query a sample and extrapolate the result back to the full scale while keeping the result close to exact.
The trade-off is obvious: when an approximate answer is sufficient, users can prioritize speed rather than forcing Elasticsearch to scan everything.
Elastic Workflows Becomes Easier to Automate
Elastic 9.5 also expands automation directly inside the Elasticsearch Platform.
Natural language authoring for Elastic Workflows is now generally available and enabled by default. Teams can describe the automation they need in normal language and have the workflow generated automatically.
Versioning is built in, allowing users to track changes, compare workflow versions, and roll back when necessary.
Visual mode represents workflow triggers, branches, steps, and logic graphically alongside YAML.
Human approval can also extend outside Kibana. For example, a workflow can pause when a decision is required and send an approval request through a collaboration tool such as Slack.
For enterprises already using Elastic across observability or security, this potentially reduces the number of external automation components required around the platform.
Native Prometheus and PromQL Support Is Now GA
One of the biggest Elastic Observability announcements in 9.5 is the general availability of native Prometheus and PromQL support.
Elastic now provides a Prometheus remote-write endpoint together with native PromQL support embedded in ES|QL.
That means organizations can move Prometheus workloads toward Elasticsearch without immediately abandoning the PromQL queries and Grafana workflows their engineering teams already understand.
This lowers one of the major barriers to observability migrations: rewriting everything at once.
Elastic has also made its migration tooling for Grafana and Datadog dashboards and alerts generally available.
According to Elastic's published figures, Elasticsearch can provide up to 2.5x better storage efficiency than Prometheus and up to 30x faster query performance for the workloads referenced in its release announcement.
Those are vendor-reported figures rather than universal performance guarantees, but they illustrate the scale of optimization Elastic is targeting.
Metrics Storage Drops to Roughly Three Bytes Per Sample
Storage efficiency receives another notable improvement.
Elastic says its new ES95 codec can reduce storage requirements for columnar metrics by approximately another 20%, bringing storage down to roughly 3 bytes per sample.
For small environments, that might sound like an incremental improvement.
At enterprise observability scale, it is not.
Metrics platforms can ingest billions of samples, so even modest reductions in per-sample storage can affect retention strategies and infrastructure costs.
Organizations may be able to retain more historical telemetry without increasing storage at the same rate.
Kubernetes Monitoring Is Now GA
Elastic's Kubernetes monitoring integration is also generally available in 9.5.
The integration ships with preconfigured:
- Dashboards
- Alerts
- Service-level objectives
- Machine learning jobs
Elastic is also simplifying Kubernetes and AWS onboarding around the recommended OpenTelemetry path.
The benefit is less setup before useful monitoring begins.
Instead of connecting telemetry and then spending days assembling the initial monitoring layer, teams can start with a more complete operational package.
Better APM and LLM Observability
Elastic 9.5 improves incident investigation by bringing dependency information closer to where engineers are already working.
Dependency analysis can surface service maps directly inside alert details and custom dashboards, reducing the need to jump between multiple views during an incident. Elastic has also improved the visibility of machine-learning-based anomaly signals inside APM service health views.
LLM observability receives a significant addition as well.
A new Anthropic integration can ingest organization-level telemetry from the Claude API platform, including token usage, cost, and rate-limit configuration, into Elasticsearch. Elastic provides prebuilt Kibana dashboards and alerts around that data.
As organizations deploy more generative AI applications, monitoring model consumption alongside application infrastructure is becoming a practical requirement rather than a niche use case.
Elastic Security 9.5 Pushes Toward "Alert Zero"
Elastic calls its security direction Alert Zero.
The name can be misleading if taken literally. It does not mean a SOC will generate zero alerts.
Instead, the goal is to reduce the analyst's working queue to the threats that actually require attention.
Attack Discovery now investigates alerts using additional context, including raw events and entity risk, before identifying something as an attack. Elastic says the system can also identify gaps where an existing detection rule missed suspicious activity and draft an ES|QL rule for an analyst to review and approve.
A separate alert analysis workflow can classify alerts as true or false positives.
The practical objective is to reduce the amount of repetitive triage analysts perform before reaching meaningful threats.
Endpoint Protection Gets Faster Threat Intelligence Updates
Elastic Security 9.5 also expands endpoint protection.
Elastic says it continuously monitors public sources for newly disclosed vulnerable drivers and can automatically generate and deploy YARA rules as new threats emerge rather than waiting for the next traditional software release cycle.
Elastic Defend also adds full Windows on ARM coverage, extending endpoint protection to ARM-based Windows devices.
An endpoint troubleshooting skill in Agent Builder can additionally help identify policy and performance problems.
Security Automation Without a Separate SOAR Layer
Elastic Workflows now extends directly into SOC automation.
A detection can trigger actions such as enrichment, case creation, investigation, and response without requiring a separate SOAR platform for every workflow. Human analysts can remain responsible for decisions that require judgment while routine steps are automated.
For organizations already consolidating security data in Elasticsearch, this is potentially important.
The value of automation increases when detection, investigation data, workflows, and response logic operate against the same underlying data platform.
Elastic Cloud Serverless Gets Easier Migration
Another useful development arrived around the 9.5 release: reindex from remote is now generally available for Elastic Cloud Serverless.
Organizations can migrate indices from Elastic Cloud Hosted deployments or other Serverless projects into Serverless environments, including across regions.
Elastic designed the process to automatically resume through infrastructure interruptions such as node shutdowns caused by scaling or software deployment events.
That removes some of the operational risk associated with moving large indexes into serverless Elasticsearch environments.
Elastic 9.5: Key Facts at a Glance
Elastic 9.5 became generally available on August 4, 2026.
Among the most notable numbers and status changes:
| Metric / Status | Detail |
|---|---|
| ~20% | Additional metrics storage reduction claimed for the ES95 codec. |
| ~3 bytes per sample | Approximate storage footprint Elastic reports for metrics using the new codec. |
| Up to 2.5x | Elastic's reported storage-efficiency advantage compared with Prometheus for the referenced metrics workloads. |
| Up to 30x | Elastic's reported query-performance improvement compared with Prometheus for the workloads cited in its announcement. |
| GA | Native Prometheus/PromQL support, Kubernetes monitoring, Dashboards & Visualizations API, dashboards in chat, natural-language workflow authoring, and Serverless reindex-from-remote are among the capabilities now generally available. |
| Technical Preview | Columnar Mode and Agent Observability and Monitoring remain technical-preview capabilities rather than mature GA features. |
That distinction matters when deciding what should immediately enter production architecture.
Who Should Pay Attention to Elastic 9.5?
Elastic 9.5 is particularly relevant to organizations working in four areas.
Large Elasticsearch and Logging Environments
Columnar storage and the new metrics codec could change the economics of storing high-volume telemetry, particularly where retention costs are becoming difficult to control.
AI and RAG Development Teams
VectorDB index mode, DiskBBQ auto-calibration, multimodal search, Agent Builder, and agent observability address several operational problems that appear when AI applications move from proof of concept to production.
SRE and Platform Engineering Teams
PromQL compatibility, Grafana migration tooling, Kubernetes monitoring, OpenTelemetry-focused onboarding, dashboards-as-code, and improved APM workflows make Elastic 9.5 especially relevant for observability consolidation.
Security Operations Teams
Attack Discovery, alert classification, endpoint improvements, AI-assisted rule creation, and native workflows are aimed directly at reducing repetitive SOC work.
Should You Upgrade to Elastic 9.5?
There is no universal answer.
Organizations interested primarily in GA capabilities such as native PromQL, Kubernetes monitoring, dashboard APIs, workflow authoring, and the latest security improvements have a clearer reason to evaluate the release.
Columnar Mode is different. It is still a technical preview, so it should be evaluated as an emerging architecture option rather than treated as the default replacement for existing Elasticsearch index strategies.
The same caution applies to Agent Observability and Monitoring while it remains in technical preview.
For larger environments, an upgrade should start with workload analysis: index patterns, ingestion volume, query behavior, integrations, plugins, retention requirements, and application dependencies all need to be considered before changing production clusters.
FAQ: Elastic 9.5
When was Elastic 9.5 released?
Elastic announced the general availability of Elastic 9.5 on August 4, 2026. The release includes updates across Elasticsearch, Observability, Security, Kibana, AI tooling, and automation.
What is Columnar Mode in Elasticsearch 9.5?
Columnar Mode is an opt-in technical-preview indexing mode that stores fields in a column store without creating an inverted index by default. It is intended to reduce storage requirements and provide a better foundation for analytical workloads, faster indexing, and longer retention.
Is Columnar Mode generally available?
No. As of Elastic 9.5, Columnar Mode is a technical preview.
What is VectorDB index mode?
VectorDB index mode is designed to simplify vector search configuration. It applies vector-optimized defaults for areas including quantization, merge policy, and cache loading, reducing the amount of manual tuning required when building semantic search and RAG applications.
Does Elastic 9.5 support PromQL?
Yes. Native Prometheus remote write and PromQL support are generally available in Elastic 9.5, with PromQL integrated into ES|QL.
Can Elastic 9.5 work with existing Grafana environments?
Elastic says existing Grafana dashboards and PromQL queries can be pointed toward Elastic with less migration work, and its migration tool for bringing Grafana and Datadog dashboards and alerts into Elastic is now GA.
What changed for AI agents in Elastic 9.5?
Elastic expanded Agent Builder with agent observability, human-in-the-loop approvals, audit trails, and the ability to create skills, queries, and workflows through conversational instructions. Agent Observability and Monitoring is currently in technical preview.
What is Alert Zero in Elastic Security?
Alert Zero is Elastic's concept of reducing a SOC's working queue to validated threats that deserve analyst attention. It does not literally mean generating zero security alerts. Attack Discovery and automated alert analysis are used to investigate and reduce the raw alert workload.
Is Elastic 9.5 available on Elastic Cloud?
Yes. Elastic states that Elastic 9.5 is available through Elastic Cloud.
What Elastic 9.5 Means for Enterprise Teams
The most important theme in Elastic 9.5 is not AI by itself. It is automation of complexity.
Vector search requires tuning, so Elastic is automating tuning.
AI agents need oversight, so Elastic is adding observability and approval controls.
SOC teams have too many alerts, so Elastic is moving more investigation and classification into automated workflows.
Observability migrations are painful when teams have years of PromQL and Grafana investment, so Elastic is supporting those existing workflows.
And enormous telemetry datasets are expensive, so Elastic is changing how some of that data can be physically stored.
That is a more meaningful direction than simply adding another collection of features.
For enterprises considering Elastic 9.5, the right question is therefore not simply "Should we upgrade?" It is "Which of these changes can materially simplify our existing Elastic architecture?"
Qavi Technologies works with organizations on Elasticsearch architecture, Elastic Stack implementation, observability, security, migrations, performance optimization, and AI-powered search. As an official Elastic Partner with more than 10 years of Elastic ecosystem experience and 250+ global customers, Qavi's focus is on turning platform capabilities into production architectures rather than enabling features without a clear operational reason.
For teams evaluating an upgrade, Prometheus migration, Elastic Cloud adoption, vector search, or a broader Elasticsearch modernization project, the strongest starting point is a review of the current workload and the specific Elastic 9.5 capabilities that can actually improve it.

More Blogs
Discover the latest insights and trends in technology with the Qavi Tech Blog. Stay updated with expert articles, industry news, and innovative ideas.

Planning an Elastic Deployment? Get the Official Checklist (Free PDF)
Reduce risks, improve performance, accelerate go-live.