
Elasticsearch Workflow UI: Visualizing Automation as a Graph in Kibana

Introduction
Elasticsearch has traditionally been known for searching, analyzing, and visualizing data. Over time, however, the platform has expanded beyond querying data to also automate actions based on that data.
One of the most interesting additions in this direction is Elastic Workflows. Elastic introduced Workflows in early 2026 as a native automation capability for the Elasticsearch Platform. Recently, Elastic has introduced Kibana Workflow UI.
Instead of looking at a workflow only as YAML, Kibana provides a visual representation where individual steps can be viewed as a connected flow. That changes how we can understand, build, and troubleshoot Elasticsearch automation.
What Are Elasticsearch Workflows?
At a high level, a workflow defines a trigger followed by one or more steps. Steps can query data, transform or analyze results, make decisions, and perform actions.
Trigger -> Step -> Step -> Condition -> Action -> Result
Elastic Workflows are declarative and YAML-based, with concepts such as triggers, inputs, and steps. Steps can perform Elasticsearch or Kibana operations, interact with external systems, control flow, or invoke AI capabilities.
Traditionally, an engineer might query Elasticsearch, analyze the results, manually investigate them, and then take an action. A workflow makes it possible to connect those operations into an automated sequence.
This moves Elasticsearch closer to being an automation platform rather than only an analytics platform. Workflows are not limited to running ES|QL queries. The workflow model can include Elasticsearch and Kibana actions, external integrations, flow-control operations, and AI-related steps. The same concept can be applied to observability, security operations, incident response, and other automation scenarios.
The Workflow UI
The most visually interesting part of the experience is the Workflow UI. The workflow is represented as connected nodes rather than as one large block of YAML.
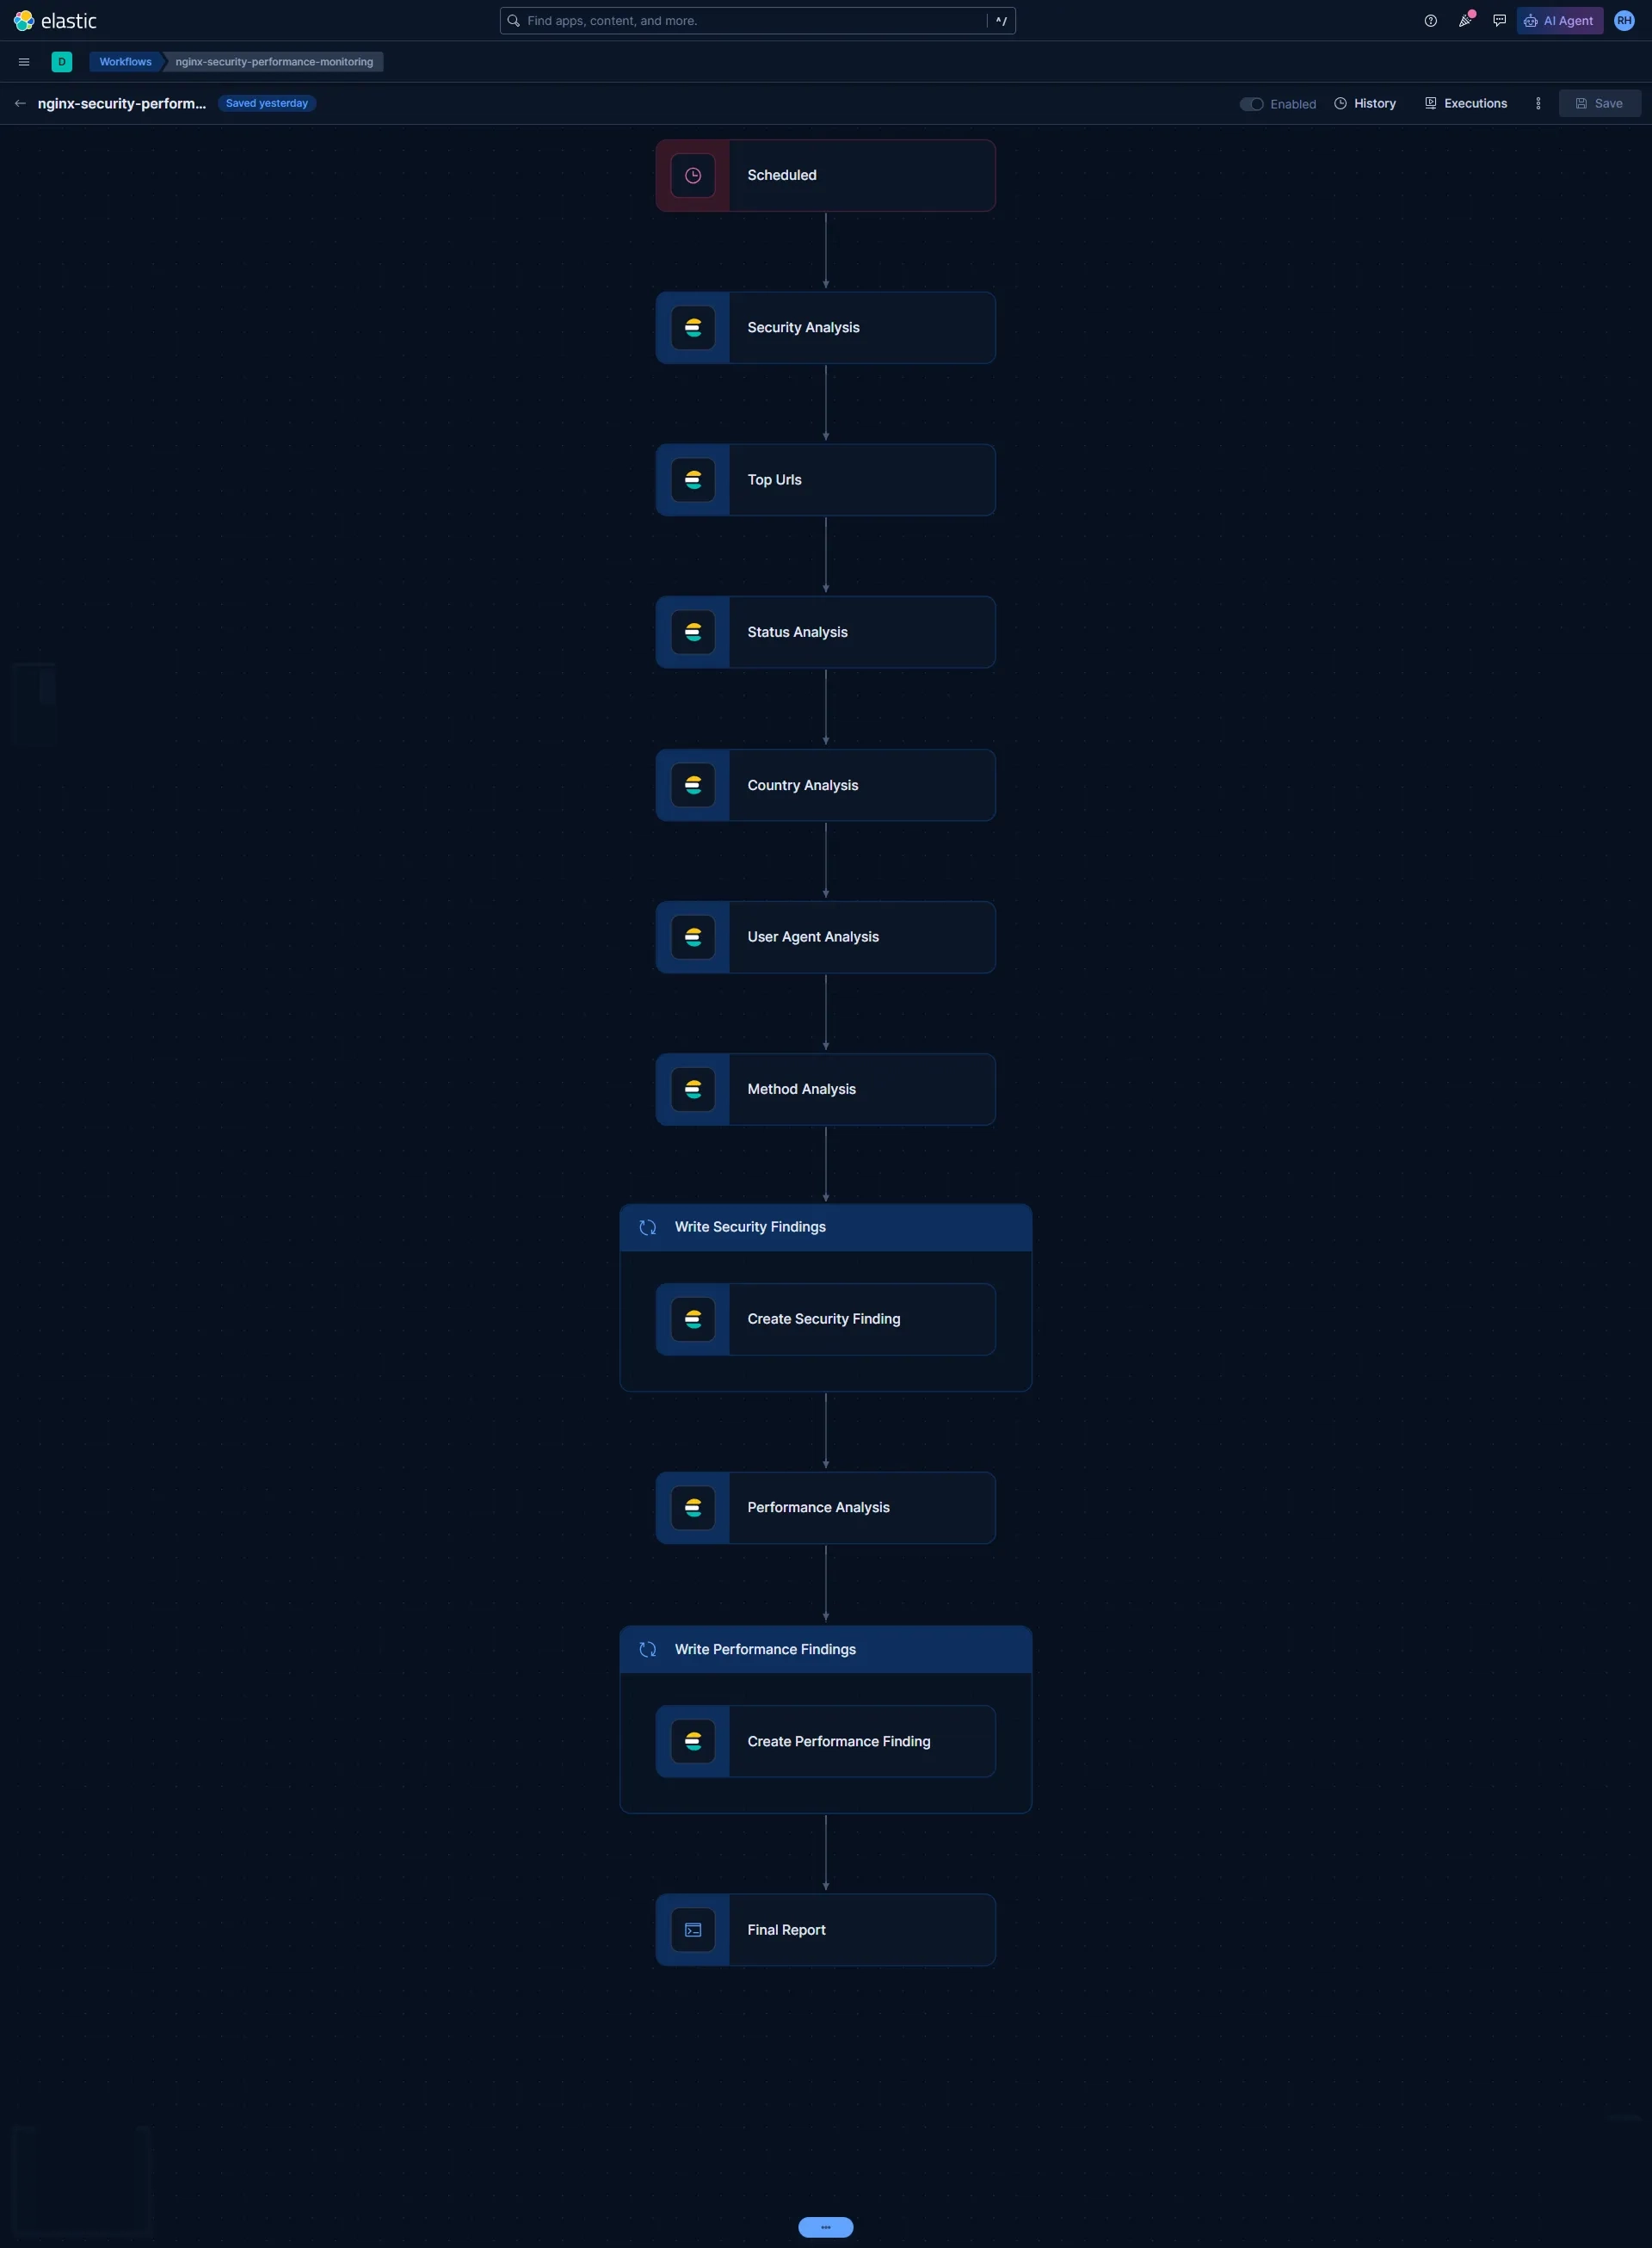
This makes the workflow's structure immediately visible. Each operation becomes a visual step, making it easier to understand the order of execution and the relationship between analysis and action.
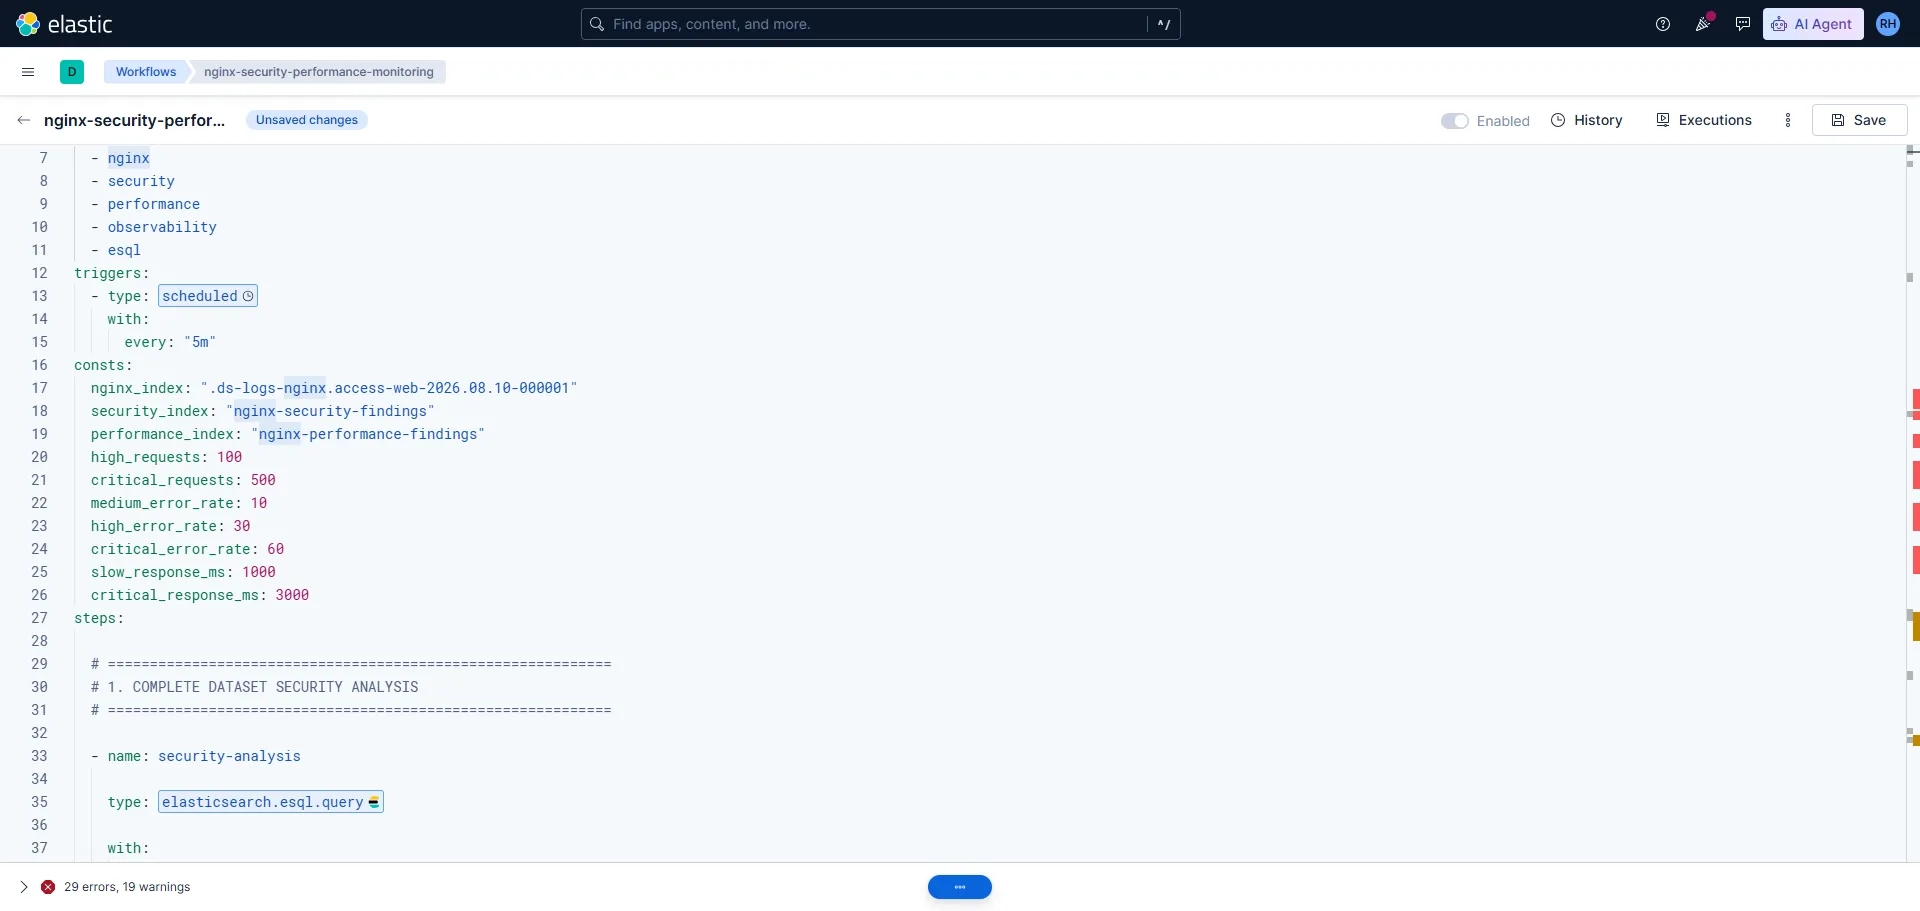
YAML is excellent for defining automation, but YAML is not always the easiest way to understand a complex automation pipeline. As workflows grow, engineers have to recall the execution flow from the configuration.
The Kibana UI provides the visual representation of that process. The combination of automation-as-code and visual workflow design is what makes the feature particularly interesting. Instead of manually traversing the YAML, you can look at the graph and immediately understand what starts the workflow, what happens next, where analysis occurs, where actions are performed, and where the workflow finishes.
The YAML definition provides control and portability, while the visual representation provides visibility and comprehension.
The use case to demonstrate the Workflow UI: Analyze NGINX traffic and identify security and performance indicators. The workflow performs security analysis, URL analysis, HTTP status analysis, country analysis, user-agent analysis, method analysis, and performance analysis.
Developer View
NGINX Example
To demonstrate the Workflow UI, NGINX access log dataset has been used.
The important part of this example is not the individual NGINX detection rules. The NGINX dataset provides a realistic data source through which the Workflow UI can demonstrate a practical multi-step automation pipeline.
Dataset Highlights:
Total Requests: 19,999Unique Source IPs: 1,1162xx: 18,2183xx: 1,2534xx: 5285xx: 0
Workflow Results Summary:
- Full dataset processed end to end. All 19,999 requests from 1,116 unique source IPs were analyzed in a single run, with no time-window filter applied, so the report reflects the entire indexed dataset rather than a sample.
- A healthy traffic baseline confirmed. Over 91% of responses were 2xx, 4xx errors stayed under 3% of total traffic, and there were zero 5xx server errors, giving a quick, data-backed read on backend health without writing a single manual query.
- Traffic broken down automatically. The workflow surfaced the top requested URLs, status-code distribution, HTTP methods, source countries, and user agents in one pass, separating legitimate visitors from crawler and bot traffic such as Googlebot, Bingbot, and AhrefsBot.
- Findings persisted for downstream use. Security and performance findings were written into their own dedicated indices, nginx-security-findings and nginx-performance-findings, so the results are immediately queryable, dashboardable, or usable as triggers for a follow-up workflow instead of living only inside a one-off report.
In short, a raw NGINX index went in, and a structured, multi-dimensional report came out, with every step of that transformation visible as a node in the Workflow UI rather than buried in a script.
Conclusion
The Kibana Workflow UI adds an important visual layer to the existing workflows feature. The NGINX example in this article was simply a practical demonstration: it allowed us to pick real access-log data, perform analysis at different stages, generate findings, and represent the entire process visually inside Kibana.
The bigger story is the workflow itself. The ability to see automation as a connected graph makes complex processes easier to understand, easier to explain, and potentially easier for teams to maintain.
For me, the most interesting part is the combination of Elasticsearch data, ES|QL, YAML automation, visual workflow design, AI or agents, and external actions within the Elastic ecosystem.

More Blogs
Discover the latest insights and trends in technology with the Qavi Tech Blog. Stay updated with expert articles, industry news, and innovative ideas.

Planning an Elastic Deployment? Get the Official Checklist (Free PDF)
Reduce risks, improve performance, accelerate go-live.