
Monitoring Your Network with Elastic Network Topology Plugin

1. Introduction
Network engineers don't just think in terms of charts and tables; they think in topologies, upstream and downstream relationships, path diversities, and the blast radius of a link failure. Yet, getting clean SNMP data from your devices into a structured, visual map in Elasticsearch has always been a notorious task.
Thanks to the Network Topology plugin for Kibana, you can now bypass the manual scripting, ingest structured routing and L2 data seamlessly, and spin up an interactive, spatial graph of your network in minutes.
The plugin ships with a ready-to-use Logstash pipeline template that covers the most common monitoring scenarios. It collects data from IF-MIB (interface statistics and status), IP-MIB (IP addresses and ARP tables), BRIDGE-MIB (MAC address forwarding tables), BGP4-MIB (BGP peer information), and OSPF-MIB (OSPF neighbor relationships) for each target device at a configurable polling interval. Simply provide your device inventory and SNMP credentials, start Logstash, and the collected metrics begin streaming into Elasticsearch.
One important scoping note before going further: the plugin is only supported on self-managed Kibana and is not compatible with Elastic Cloud Hosted or Elastic Cloud Serverless. If your deployment runs on Cloud, this is a self-managed-only capability worth planning around.
2. How the Data Pipeline Works
The plugin doesn't invent a new data source, it relies on a well-defined SNMP collection pipeline feeding into Elasticsearch. Logstash polls SNMP-enabled devices on the network, writes the collected data into an Elasticsearch data stream, an ingest pipeline classifies each document by device type and vendor, and the plugin then reads from that data stream to display sites, devices, and topology in Kibana.
That's a clean four-stage flow: poll → index → enrich → visualize, which is worth understanding before looking at individual features, since each one builds on this pipeline.
3. Core Features
3.1 A Reference Logstash Pipeline Built on Standard MIBs
Rather than requiring teams to hand-roll their own SNMP polling logic, the plugin ships a reference Logstash pipeline that walks the IF-MIB for interface counters and status, IP-MIB for ARP tables and IP address assignments, BRIDGE-MIB for MAC address forwarding tables, BGP4-MIB for BGP peer sessions, and OSPF-MIB for OSPF neighbor adjacencies on each target device at a configurable poll interval.
3.2 Automatic Device Classification via Ingest Pipeline
Once SNMP data lands in Elasticsearch, the snmp-device-enrichment ingest pipeline parses each device sysDescr string to assign a normalized host.type (router, switch, firewall, access point, or server) along with an observer.vendor field.
The pipeline recognizes common vendors out of the box, including Cisco, Juniper, Arista, Fortinet, Palo Alto, HPE, and Aruba, and is extensible for less common hardware. For teams running Cisco-heavy environments, this means devices get classified and vendor-tagged automatically rather than needing manual field mapping per device type.

3.3 Interactive Topology Graph
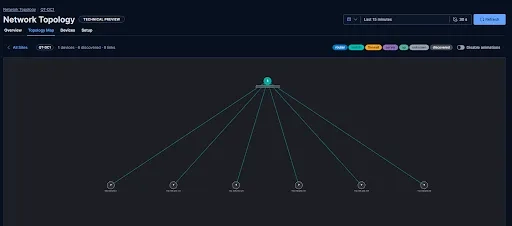
An interactive topology graph appears in Kibana's Observability navigation, building an adjacency graph from ARP, MAC table, BGP, and OSPF relationships and rendering it as a force-directed layout that you can zoom, pan, and rearrange.
The topology map goes further than a single static rendering: it builds the adjacency graph from ARP, MAC forwarding table, BGP, and OSPF data, and lets you toggle L2, L3, BGP, and OSPF layers independently so you can focus on a specific protocol rather than viewing every relationship type overlaid at once. Link colors and styles indicate state, giving an at-a-glance read on health without opening individual devices.
3.4 Real-Time Health Status
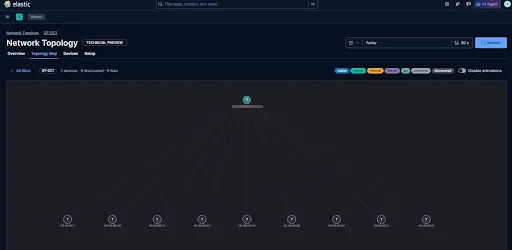
The topology map continuously reflects the health of your monitored network based on the incoming SNMP data. As long as a device is successfully polled and fresh data continues to arrive in Elasticsearch, the device and its associated links remain in a healthy state. If SNMP polling stops whether due to a device outage, network connectivity issue, authentication failure, or the Logstash pipeline no longer receiving data the plugin marks the affected device and its relationships as red, providing an immediate visual indication that the device is no longer reporting. This allows operators to quickly distinguish between a healthy, actively monitored network and one where data collection has been interrupted, making it easier to identify monitoring gaps or infrastructure failures at a glance.
3.5 Per-Device Detail Flyout
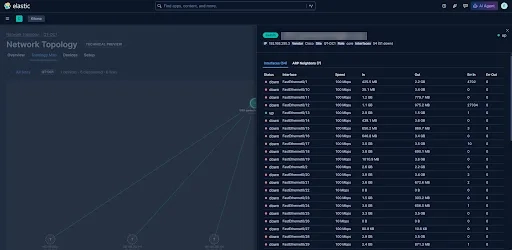
Clicking a device opens a flyout with its interface table, ARP neighbors, BGP peers, and OSPF adjacencies all without leaving the topology view. This is the feature that turns the graph from "a picture of the network" into an actual troubleshooting surface: an engineer can spot a red link, click the affected node, and immediately see the specific interface or protocol session driving the problem.
4. Conclusion
Elastic's Network Topology plugin turns raw SNMP polling into a navigable, protocol-aware map of your infrastructure, backed by a reference Logstash pipeline, automatic device classification, and an interactive graph with per-device drill-down. For self-managed Kibana deployments aimed for monitoring switches, routers, and multi-site connectivity, it closes a real gap between "we have metrics" and "we can see how our network is actually wired together."

More Blogs
Discover the latest insights and trends in technology with the Qavi Tech Blog. Stay updated with expert articles, industry news, and innovative ideas.

Planning an Elastic Deployment? Get the Official Checklist (Free PDF)
Reduce risks, improve performance, accelerate go-live.