
Zabbix 8.0: Advancing Infrastructure Monitoring and Observability
Introduction
Zabbix 8.0 marks a significant evolution in open-source infrastructure monitoring, introducing powerful enhancements that extend its capabilities beyond traditional infrastructure monitoring.
From better application visibility and AI-assisted investigation to improved dashboards, templates, security, and administration, there's quite a bit happening in this release.
Some feature additions could make a real difference for teams managing large, distributed environments. Others are more about improving the overall experience. What matters is understanding where these improvements fit, what problems they solve, and whether they bring any real value to your existing monitoring environment.
In this blog, I'll walk through Zabbix 8.0 from a practical operations perspective, explore the features that caught my attention, discuss where I think they could be useful, and cover a few things worth considering before planning your upgrade.
1. APM (Application Performance Monitoring)
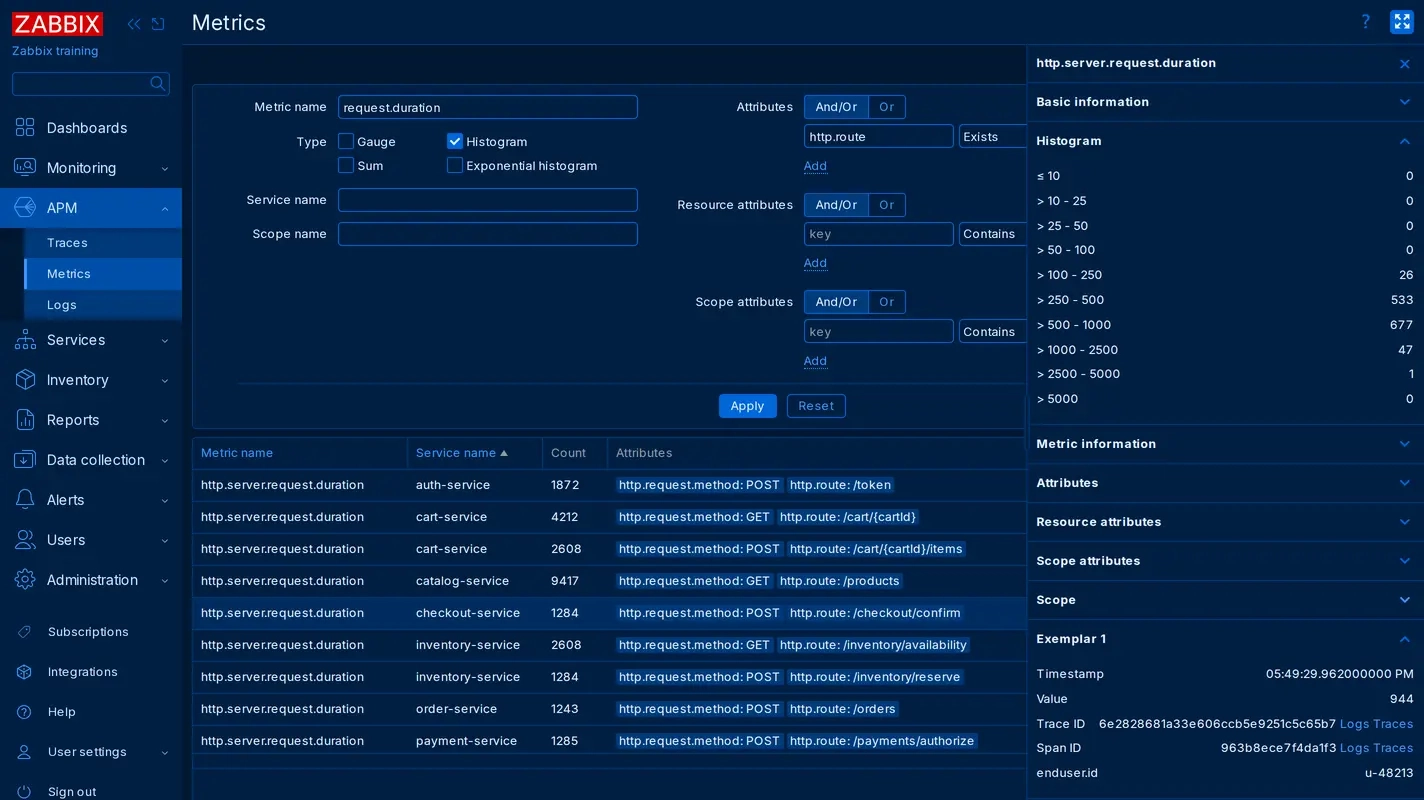
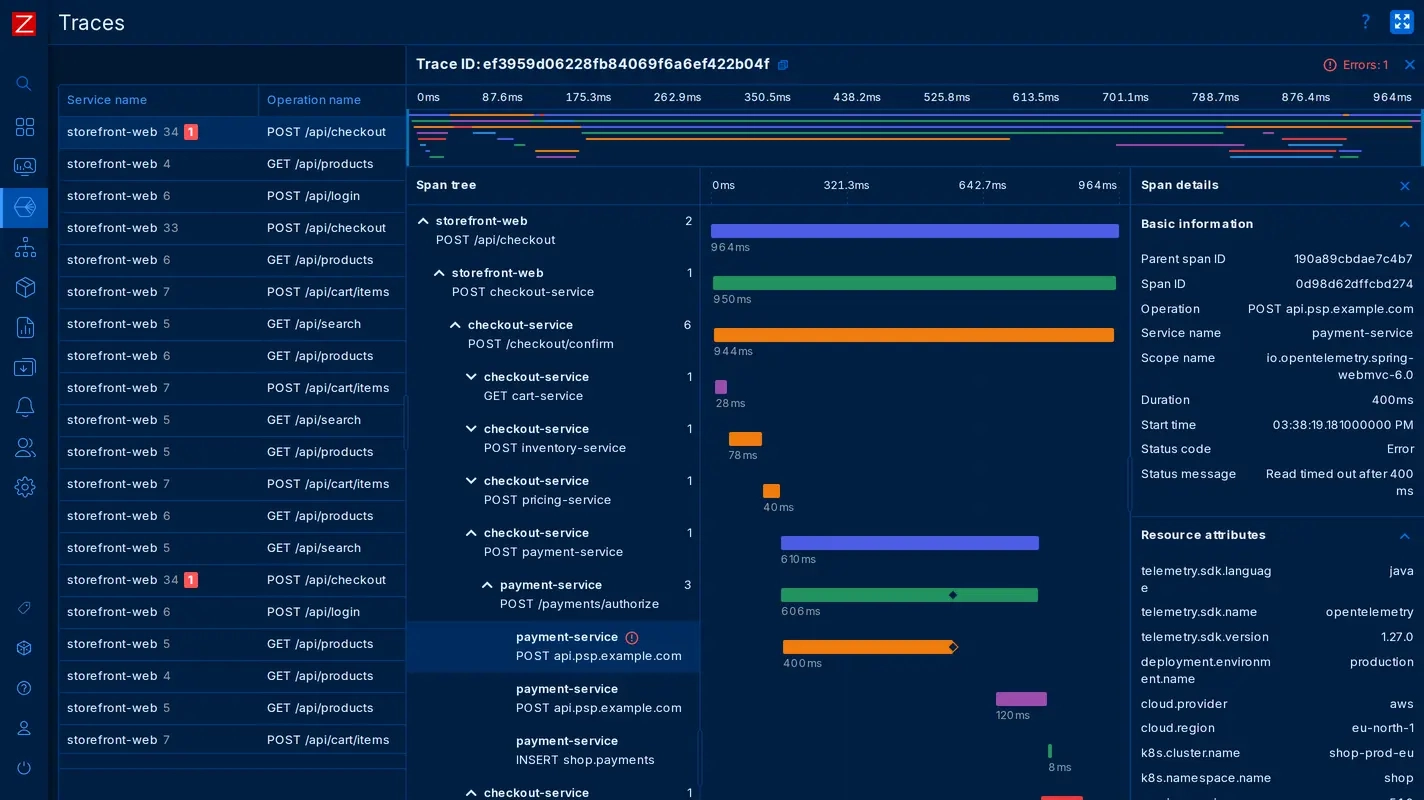
The most interesting part of Zabbix 8.0, in my opinion, is OpenTelemetry-based Application Performance Monitoring (APM).
This solves a very common problem: the server looks healthy, but the application is slow. CPU and memory are fine, yet users are complaining about failed requests or high latency. Traditional infrastructure monitoring often cannot explain that. You stare at a green dashboard while users stare at a spinning loader and nobody is happy.
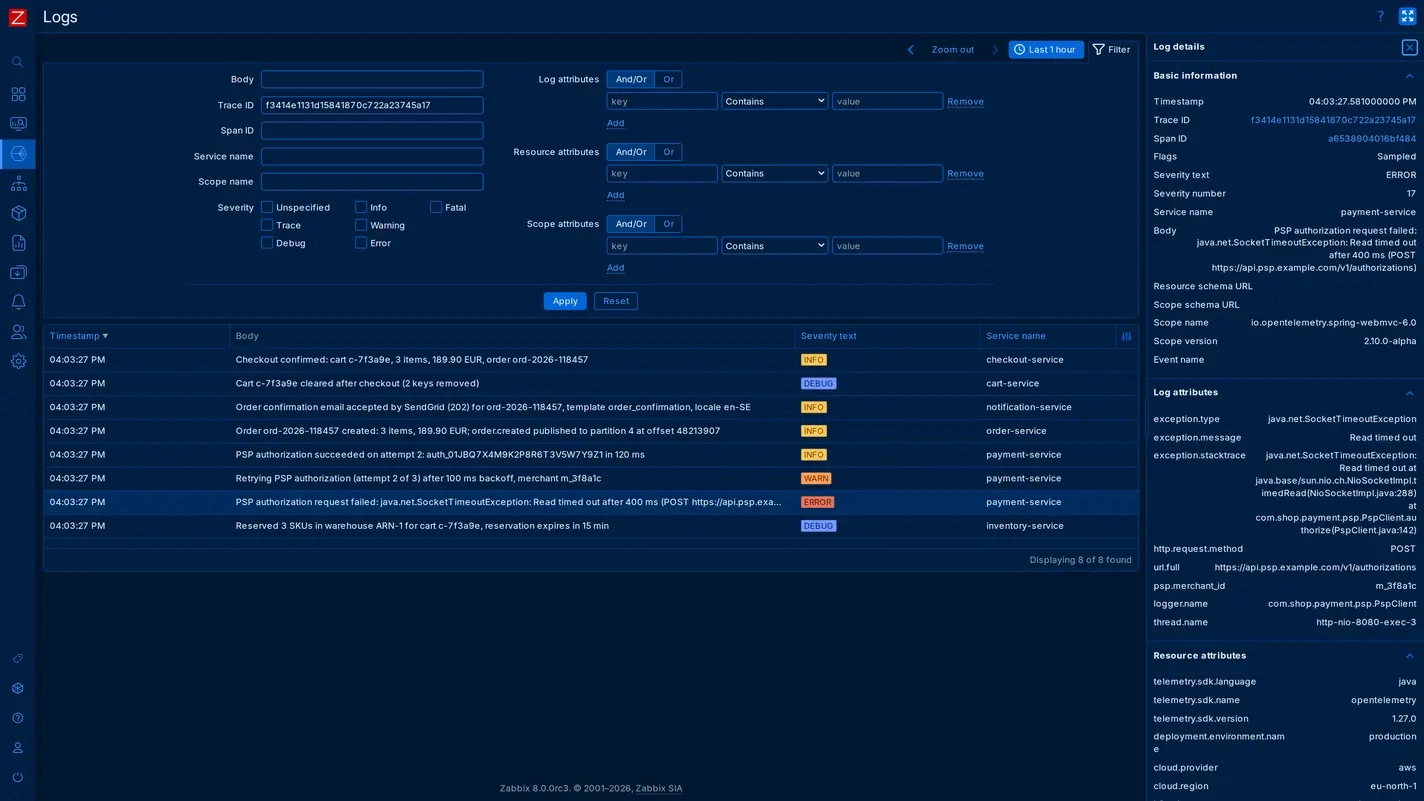
With OpenTelemetry data, Zabbix can bring application-level context such as metrics, logs, and traces, into the same monitoring platform. That means the same tool that tells you a host is up can also tell you why a request is slow.
Imagine that a checkout service becomes slow. Server metrics look normal. An OpenTelemetry trace shows that the payment service call is taking too long. The administrator can now compare application traces with infrastructure metrics instead of jumping between tools. The investigation moves from "is the server okay? " to "which service inside the request is slow?" which is where the real answer usually lives.
2. MCP Server for AI-Powered Monitoring
Zabbix 8.0 introduces an MCP (Model Context Protocol) server that allows compatible AI agents to interact with Zabbix monitoring data.
One day a high CPU alert fires. Instead of manually opening multiple dashboards, an administrator can ask an AI agent to investigate the host's recent CPU trend and related problems. The agent uses Zabbix data through the MCP server and returns a summarized view such as recent spikes, related triggers, and recent changes.
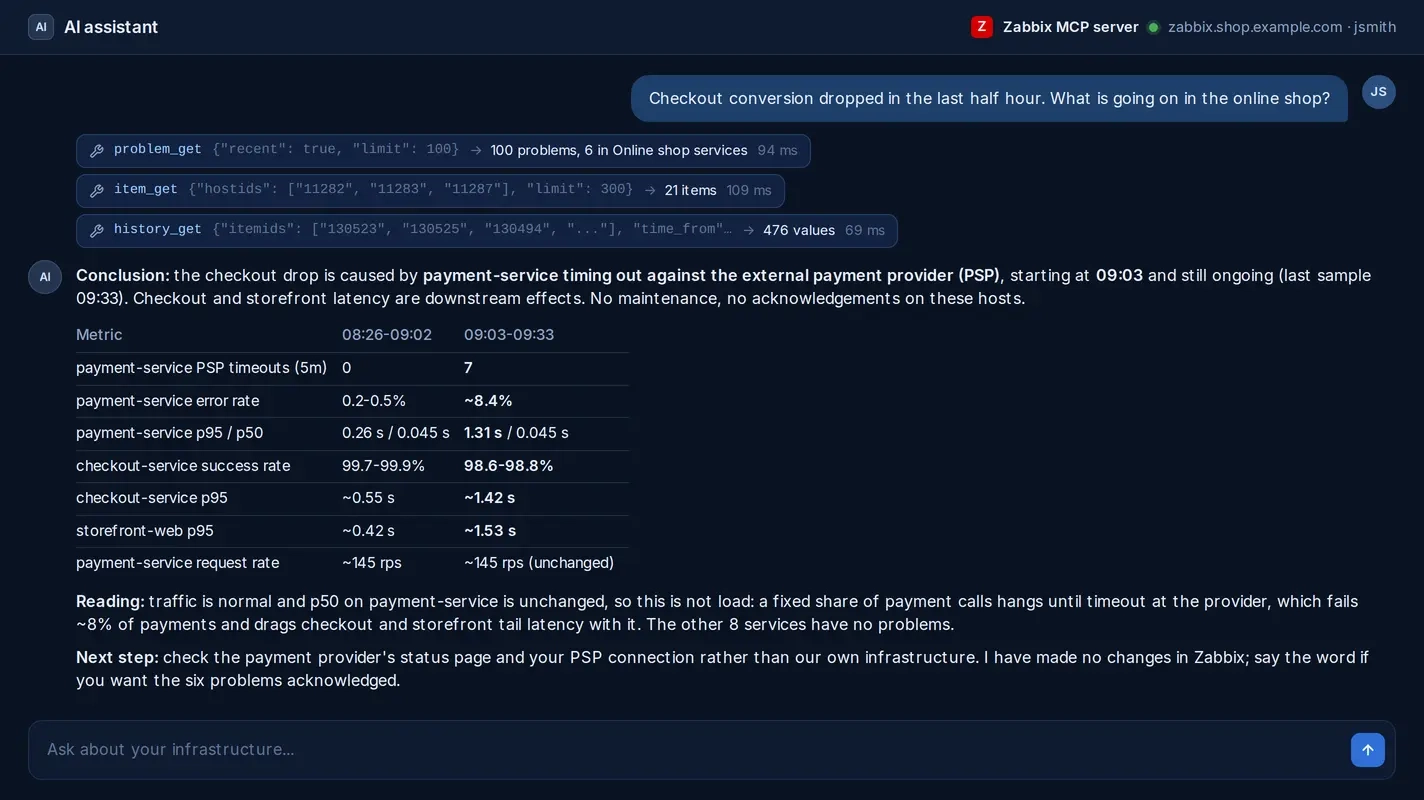
What I like here is that the MCP server respects existing Zabbix user permissions and roles. That is important: an AI agent should not see more than the human operating it. Security-conscious teams will appreciate that this was considered from the start.
3. Customizable Views
If you manage hundreds of hosts, customizable table views are a real quality-of-life improvement. Different administrators need different information, and forcing everyone into one default table has always been a small but constant irritation.
A NOC team may need a view with hostname, IP address, and availability. A platform team may prefer inventory details and problem severity. Zabbix 8.0 lets users create and configure multiple views, resize columns, rearrange them, and even pull in inventory data.
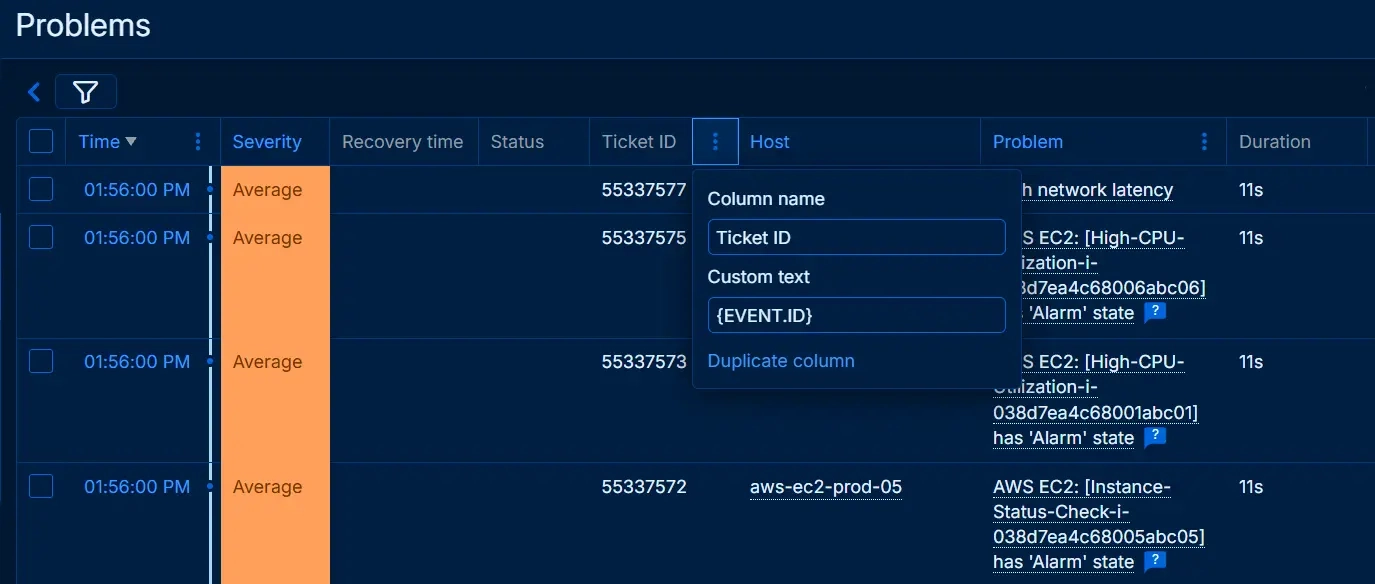
This sounds simple, but in large environments it matters. When an on-call engineer opens a table at 3 AM, the less time they spend scanning irrelevant columns, the faster they respond.
4. UI and UX Improvements
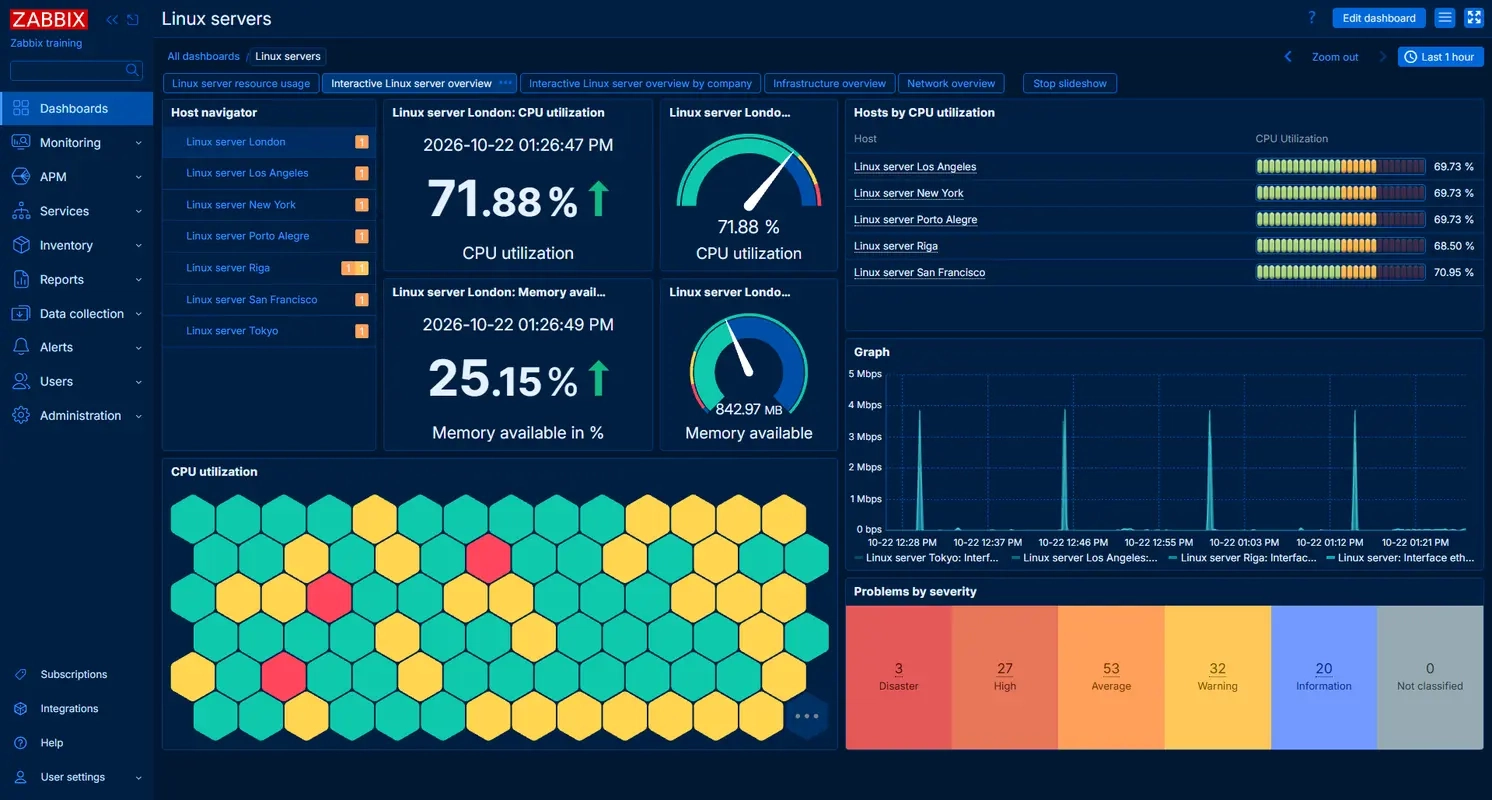
Zabbix 8.0 includes a new dark blue theme, inline validation, full tag inheritance, SAML certificate/key import, and updated fonts.
Individually, these are small changes. Together, they make daily administration smoother. And in a platform that administrators use for hours every day, smoother administration adds up.
Inline validation catches incorrect input while you are filling a form, instead of letting you discover the error later. That sounds minor, but it saves time during configuration, especially when you are setting up a new template with dozens of fields. Full tag inheritance for templates, hosts, and items also helps keep tagging consistent as configurations grow.
Pretty much every Zabbix administrator, but particularly those who regularly work with configuration forms, templates, and monitoring setups. It can make routine administrative tasks a little easier and reduce the time spent managing configurations.
5. Dashboards and Visualization
Zabbix 8.0 adds dashboard export/import, a scatter plot widget, improved graph widgets, metric highlighting, geomap clustering, and a Top Items widget.
Export a NOC dashboard from production and import it into staging to reuse the same layout. Use the scatter plot to explore the relationship between CPU usage and latency. Highlight a metric across graph widgets to compare the same signal in different views. Geomap clustering keeps large maps readable by grouping nearby markers.
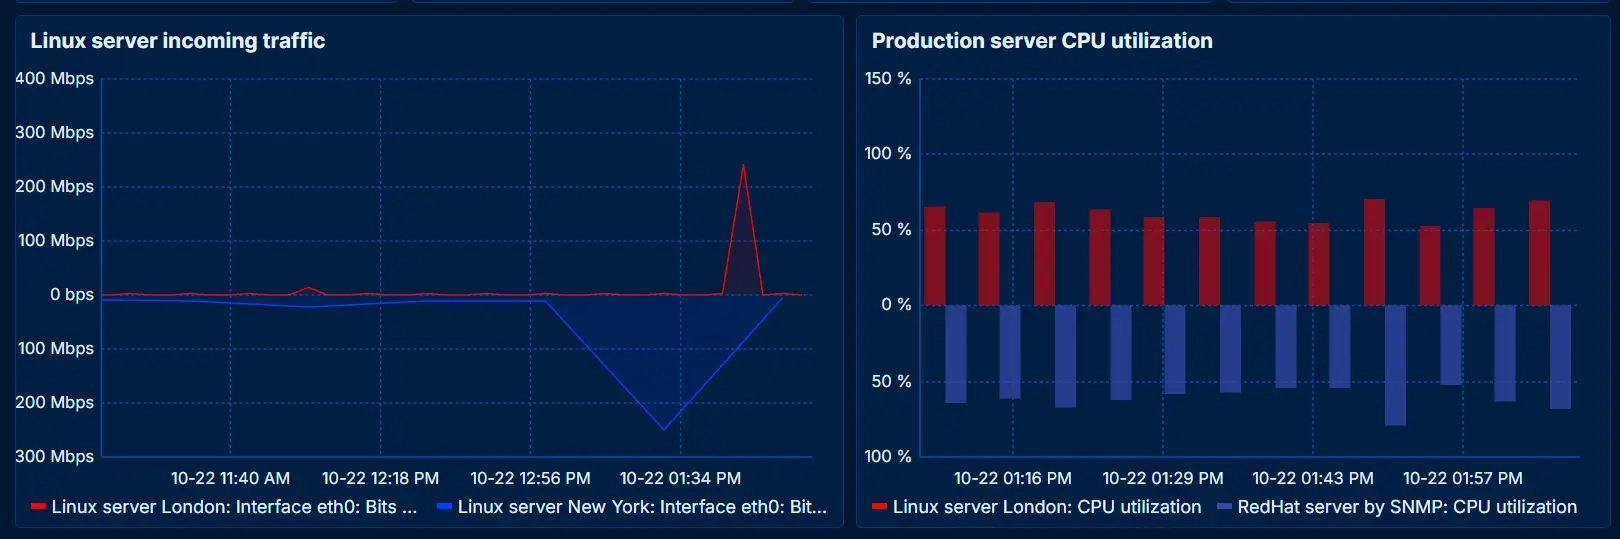
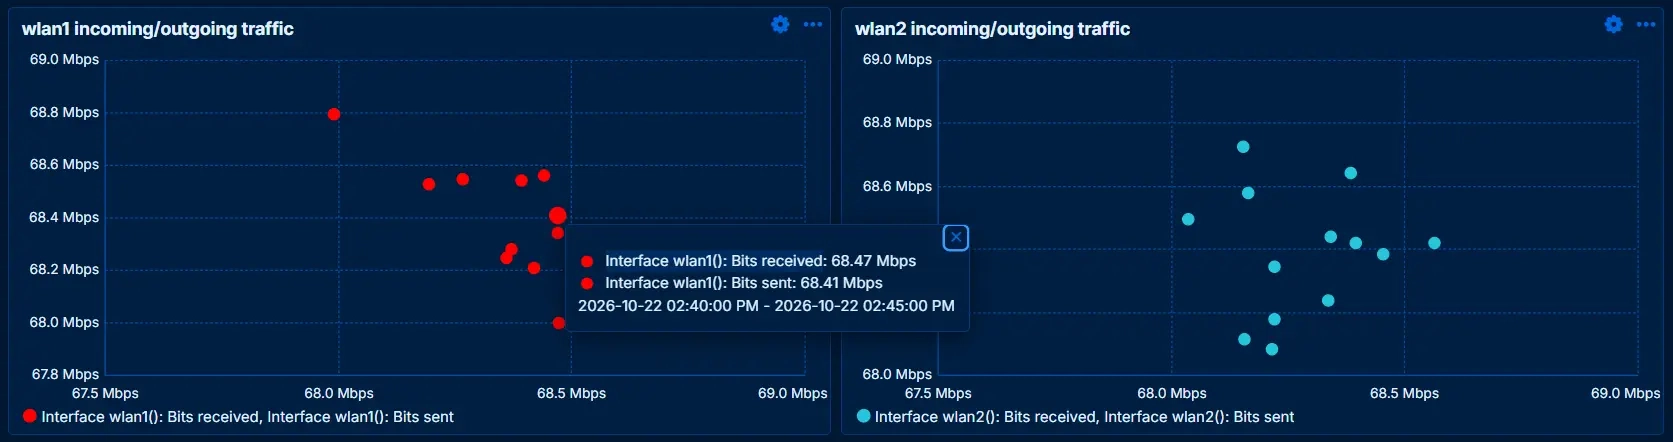
Dashboard export/import is the one I expect many teams to use most. Rebuilding the same dashboard across environments has always been tedious, and being able to move layouts around is a quiet but welcome improvement.
6. New Templates and Integrations
Zabbix 8.0 adds templates for AWS Backup Vault, Azure Container Apps, Google Cloud Run, Google Cloud Storage, Aruba CX, Cisco Secure Firewall, Ciena, Kubernetes, Hyper-V, Podman, Proxmox VE, MariaDB, Percona, Azure Sentinel, GLPI, Claude API, and OpenAI Platform.
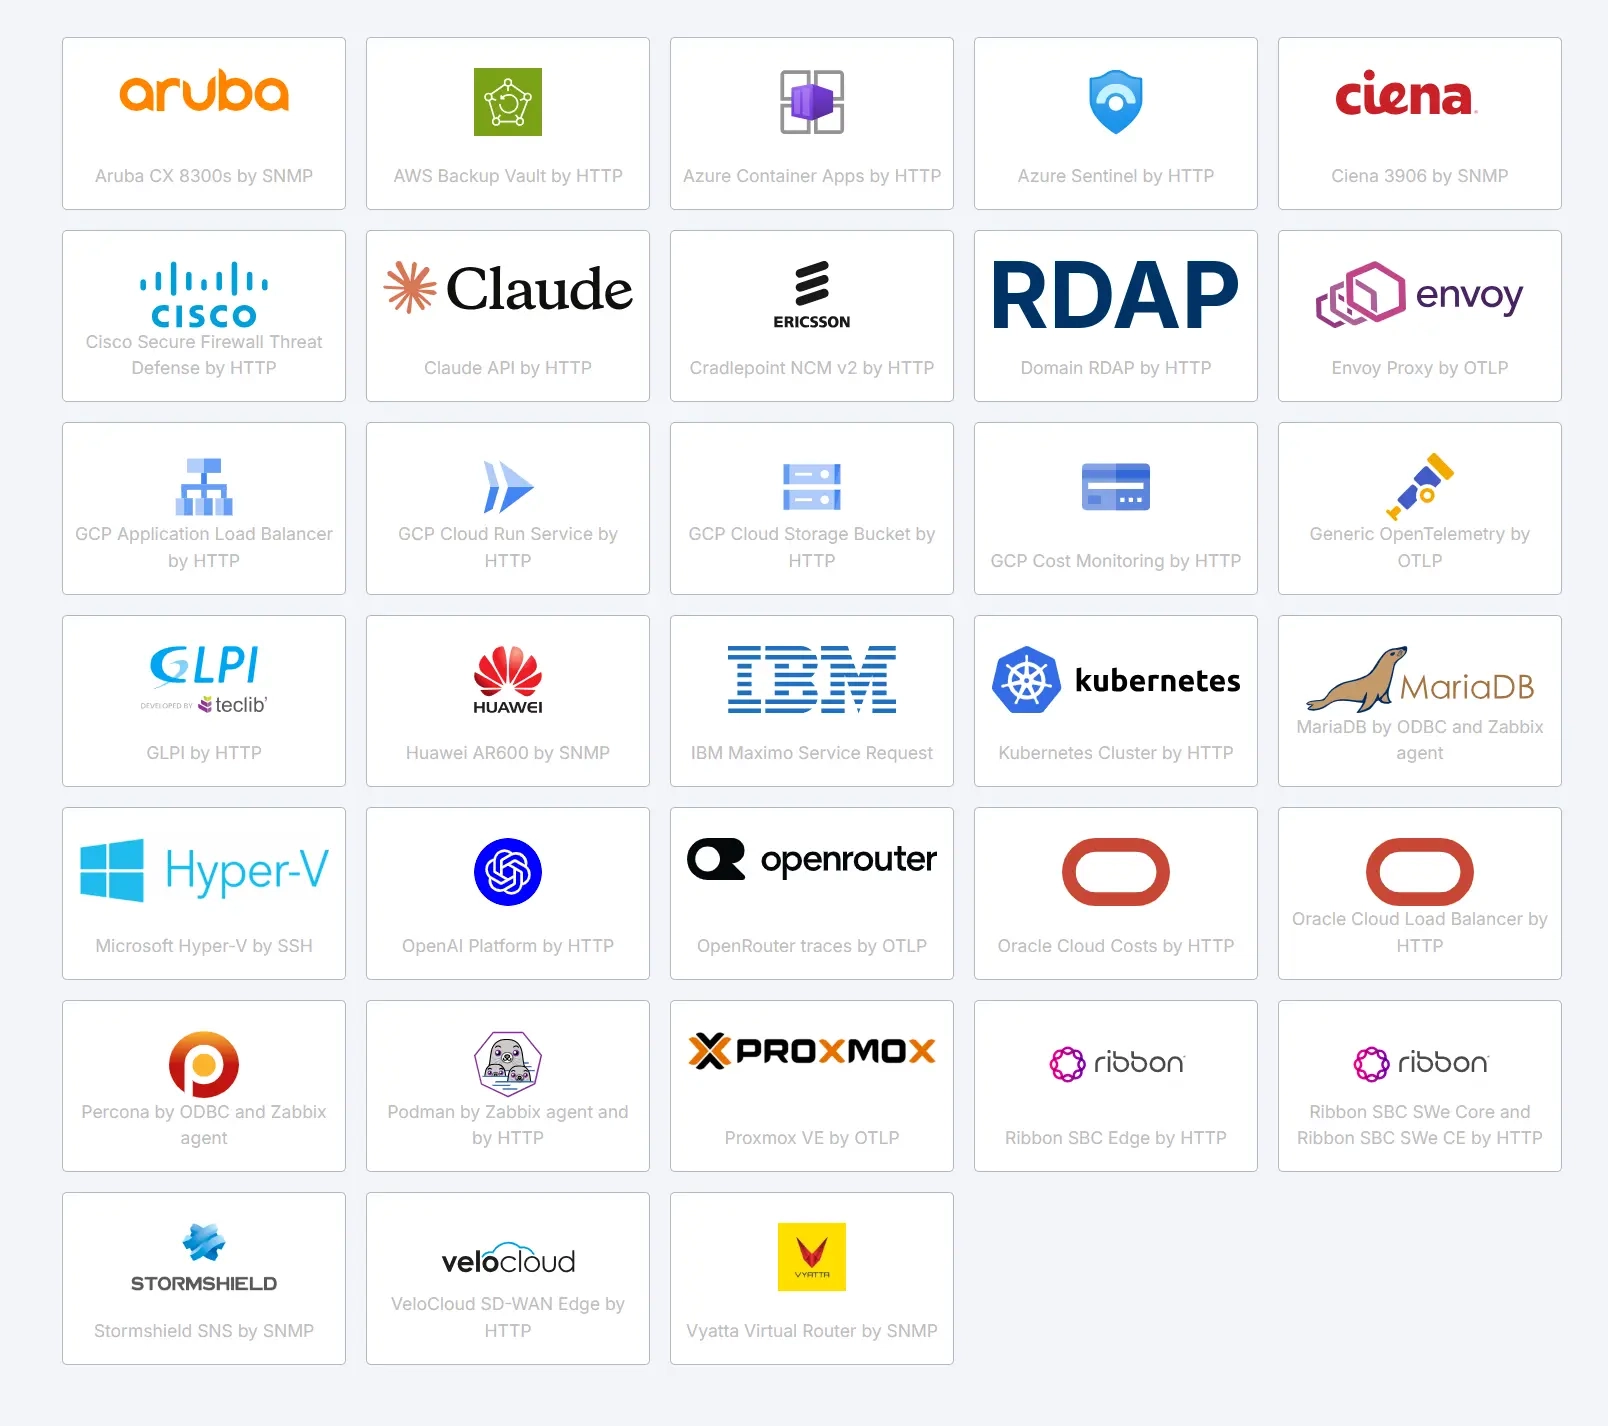
You can start basic Proxmox VE monitoring quickly using the new template. But before using it in production, verify item keys, thresholds, and supported versions in a lab. Templates are starting points, not finished products. Every environment has its own quirks.
The AI service templates (Claude API, OpenAI Platform) are an interesting signal. Zabbix is clearly watching where the industry is going, and monitoring AI services is now a legitimate need for many teams.
This is particularly useful for teams that need to bring new platforms into their monitoring environment quickly. It also benefits organizations that prefer adapting existing templates to their requirements rather than building monitoring configurations from scratch, saving both time and administrative effort.
7. Mobile App (Coming Soon)
The official Zabbix 8.0 overview mentions an upcoming mobile app with remote connection, end-to-end encryption, incident filtering, problem response, push notifications, and iOS/Android support.
This is a useful direction for administrators who need to stay informed while away from their desks. But since it is listed as coming soon, it should not be the main reason to upgrade today. Plan for it, but do not depend on it yet.
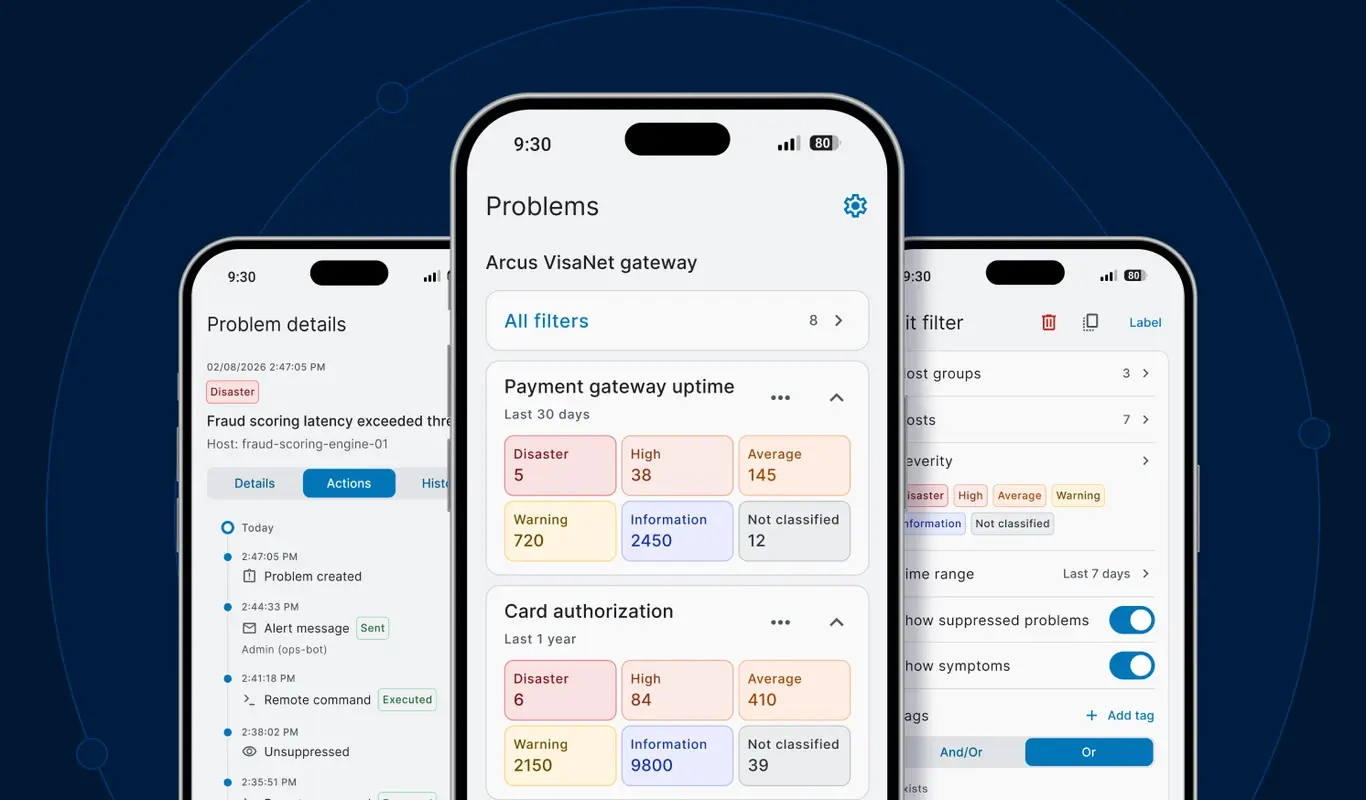
This is particularly valuable for on-call engineers and administrators responsible for critical infrastructure, where identifying issues quickly and responding to incidents with minimal delay can make a significant difference.
8. Additional Improvements
Zabbix 8.0 also adds multiple PostgreSQL backend nodes, a JSON data type, more secure default API permissions, HashiCorp Vault AppRole authentication, improved network discovery, multi-cloud cost monitoring, audit log export, and DNS caching/failover improvements.
Improved API security and HashiCorp Vault integration are useful for organizations with stricter security requirements.
Multi-cloud cost monitoring helps teams track spending across AWS, Azure, GCP, and Oracle Cloud, a growing need as more companies spread workloads across providers.
This is particularly useful for organizations managing complex infrastructure, strict security requirements, or multi-cloud environments, where maintaining visibility, control, and consistency across different systems is essential.
Final Thoughts
The most valuable additions, in my opinion, are OpenTelemetry-based APM, customizable views, dashboard improvements, the MCP server, and the expanded template collection. The mobile app would be a valuable addition once it becomes available.
For existing Zabbix users, Zabbix 8.0 offers good reasons to explore the new version, especially if you need better application visibility or manage a large environment. For teams evaluating monitoring platforms, it shows that Zabbix is moving towards a more connected and full-fledged observability experience.
The release makes one thing clear: Zabbix is no longer just an infrastructure monitoring tool. It is slowly becoming a broader observability platform and Zabbix 8.0 is a meaningful step in that direction.

More Blogs
Discover the latest insights and trends in technology with the Qavi Tech Blog. Stay updated with expert articles, industry news, and innovative ideas.
Planning an Elastic Deployment? Get the Official Checklist (Free PDF)
Reduce risks, improve performance, accelerate go-live.