Elastic (ELK) Stack- Powered Monitoring for MikroTik Load Balancer:
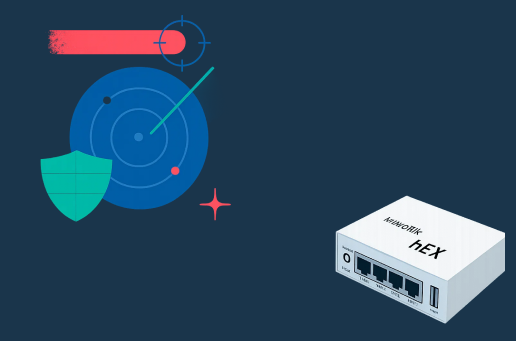
To maintain consistent and reliable network load balancing, we’ve built a real-time monitoring system using the Elastic Stack (Elasticsearch, Logstash, and Kibana). This setup provides full visibility into the performance and health of our MikroTik Load Balancer hEX (RouterOS E50UG).
Using SNMP integrated through Logstash, the system automatically collects live data from the MikroTik device—tracking interface utilization, packet flow, system resources, and uptime.
This data is indexed into Elasticsearch and visualized in Kibana dashboards, allowing our network & IT team to monitor link performance, device stability, and resource usage in real time.
With this monitoring dashboard, administrators can easily detect abnormal traffic behavior, ensure all interfaces remain up, and maintain consistent throughput across multiple WAN connections.
2.1 Architecture Overview
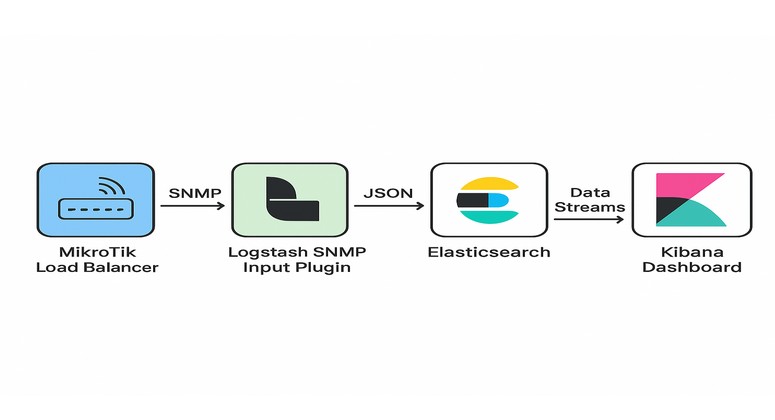
Data Flow:
- SNMP (Simple Network Management Protocol) is used to collect interface and system metrics from the MikroTik Load Balancer.
- Logstash SNMP Input Plugin polls OIDs periodically (every interval) and converts data into structured JSON.
- Data is then indexed into Elasticsearch using data streams.
- Kibana Dashboard visualizes real-time and historical trends of traffic and device health
2.2 Load Balancer Overview:
The MikroTik heX (RouterOS E50UG) load balancer is the central gateway managing traffic between multiple WAN interfaces (PTCL, STORM, FIBERISH, TRANS) and the LAN network.
The interface overview panel displays:
- Interface Status: “Up” or “Down” state for each WAN/LAN port
- Speed and MTU: For performance and frame-size visibility
- Traffic (Bytes/Packets): Inbound and outbound data trends over time
- Error and Discard Counters: Showing link stability
This section gives a complete picture of network utilization across all interfaces. It helps identify high-usage connections and monitor link performance in real time.
The time-series charts clearly display traffic peaks, idle periods, and packet rates. For example:
- WAN2_PTCL and WAN3_STORM exhibit balanced load distribution, showing how the RouterOS load balancing rules are efficiently routing traffic across links.
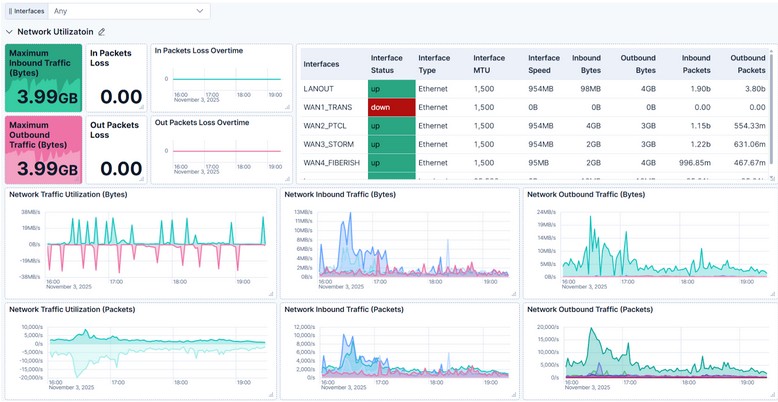
Insight:
Stable, symmetrical patterns between inbound and outbound traffic confirm proper routing and equal distribution of sessions across WAN links—critical for consistent network performance.
Each WAN interface has its own detailed section on the dashboard:
Included Panels:
- Interface Status: Shows if the port is up or down.
- Host Uptime: Days since last reboot (e.g., 29 days uptime shows device stability).
- In/Out Packets Loss Overtime: Detects intermittent packet loss trends.
- Inbound/Outbound Traffic (Bytes/Packets): Time series of throughput in both directions.
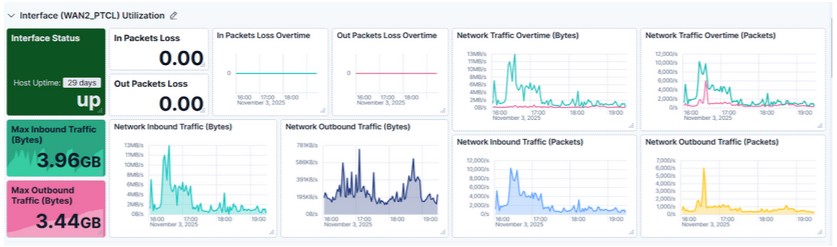
Insight:
These statistics confirm all links are healthy and operating at full efficiency. No packet drops or interface resets indicate optimal routing and link reliability.
The dashboard also tracks hardware and system performance metrics for the MikroTik device using SNMP OIDs.The temperature gauges help identify cooling issues, while the voltage indicator confirms stable power delivery. Together, these ensure hardware reliability over extended operation.

Insight:
Temperature under 60°C and voltage around 24.1Volt indicate that the RouterOS E50UG is operating well within safe parameters, with no overheating or power fluctuations.
This section visualizes CPU, Memory, and Disk usage trends over time—vital for assessing system load and capacity planning.
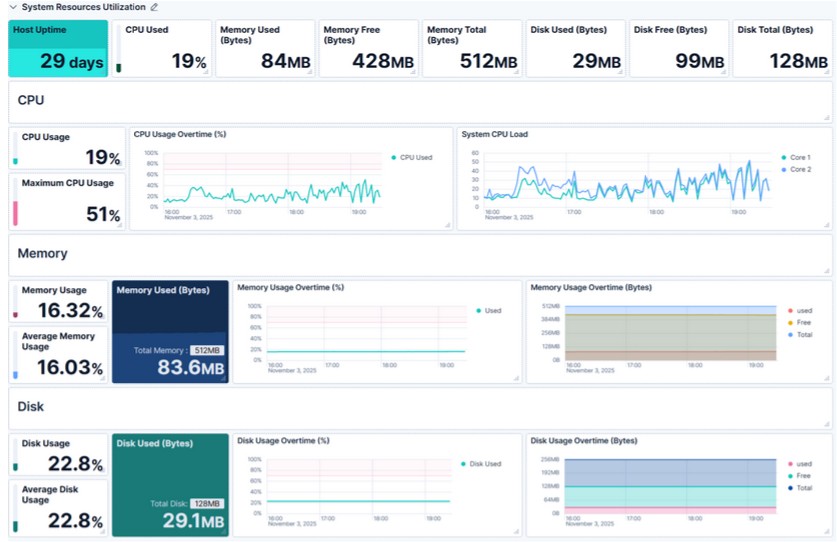
Insight:
CPU, memory, and disk remain well below critical thresholds, leaving headroom for future traffic growth or additional SNMP polling intervals.
Proactive Monitoring: Detect bandwidth overuse and packet drops before users experience downtime.
Resource Optimization: Track CPU/memory usage for capacity planning.
Historical Trend Analysis: Compare link performance over weeks.
Unified Observability: All SNMP metrics in one centralized Elastic Stack.
Custom Alerts: Configure Kibana alerts for thresholds.
Real-time SNMP data collected through Logstash provides clear visibility into every aspect of the device—network throughput, uptime, and hardware health.
With proactive monitoring and visual analytics from Kibana, network administrators can detect issues early, maintain uptime, and ensure high-speed connectivity across the organization.
This Elastic-powered observability setup delivers enterprise-grade transparency and reliability, ensuring that the network runs efficiently and remains ready for future expansion.