The Elasticsearch Query Language (ESQL) stands out as a powerful tool for manipulating and analyzing data stored in Elasticsearch. Elasticsearch Query Language enables users to craft queries for event filtering, statistical analysis, and visualization creation, offering a rich set of commands and functions for diverse data operations like aggregation and time-series analysis. This flexibility is underpinned by a groundbreaking compute architecture that executes elastic search esql functions directly within Elasticsearch, ensuring exceptional performance and versatility. The architecture operates on blocks of data rather than individual rows, emphasizing vectorization, cache locality, and multithreading. ESQL represents a significant leap in Elasticsearch’s capabilities, promising efficient and effective data handling for a wide range of applications.
ES|QL adds 3 powerful capabilities to the Elastic Stack
- Introducing a cutting-edge Distributed & Dedicated Query Engine that enhances _query performance. The new ES|QL query engine offers advanced search functionalities with concurrent processing, boosting speed and efficiency regardless of data source or structure.
- ES|QL introduces a robust and versatile piped language designed by Elastic. This new language streamlines data investigations by transforming and enriching data effortlessly. For more information on ESQL’s features, refer to the documentation.
-
Delving deeper into security and observability use cases
Our dedication to ES|QL is rooted in a thorough understanding of the challenges faced by our users, such as site reliability engineers (SREs) and DevOps team
For SREs, observability is critical. Every moment of downtime or any glitch can significantly impact user experience and, ultimately, the bottom line. ES|QL’s Alerting feature, which emphasizes highlighting significant trends over isolated incidents, enables SREs to proactively identify and resolve system inefficiencies or failures. This reduces unnecessary noise, allowing them to respond to real threats to system stability more promptly and effectively.
Get started with ES|QL in Kibana
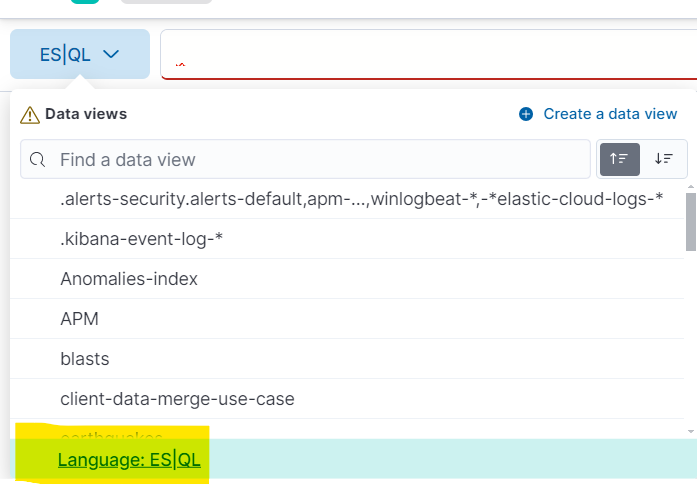
To begin using ES|QL, navigate to Discover and simply select Language ES|QL from the data-view picker. It’s user-friendly and straightforward.
This will get you into ES|QL mode in Discover.
Analyze and visualize data with ES|QL
ES|QL query with use case:
1) How to combine eval and keep using where condition. Create a query which that returns a clientip with the number of bytes where the Client IP is not a local one and bytes are higher than 2000
from kibana_sample_data_logs
| Keep clientip, bytes
| eval high_bytes=bytes > 2000
| eval local_ip= cidr_match(clientip,”127.0.0.0/8″)
| where high_bytesand not local_ip
This query retrieves client IP addresses along with the number of bytes for each log entry from the kibana_sample_data_logs index, filtering out local IP addresses and entries with less than or equal to 2000 bytes.

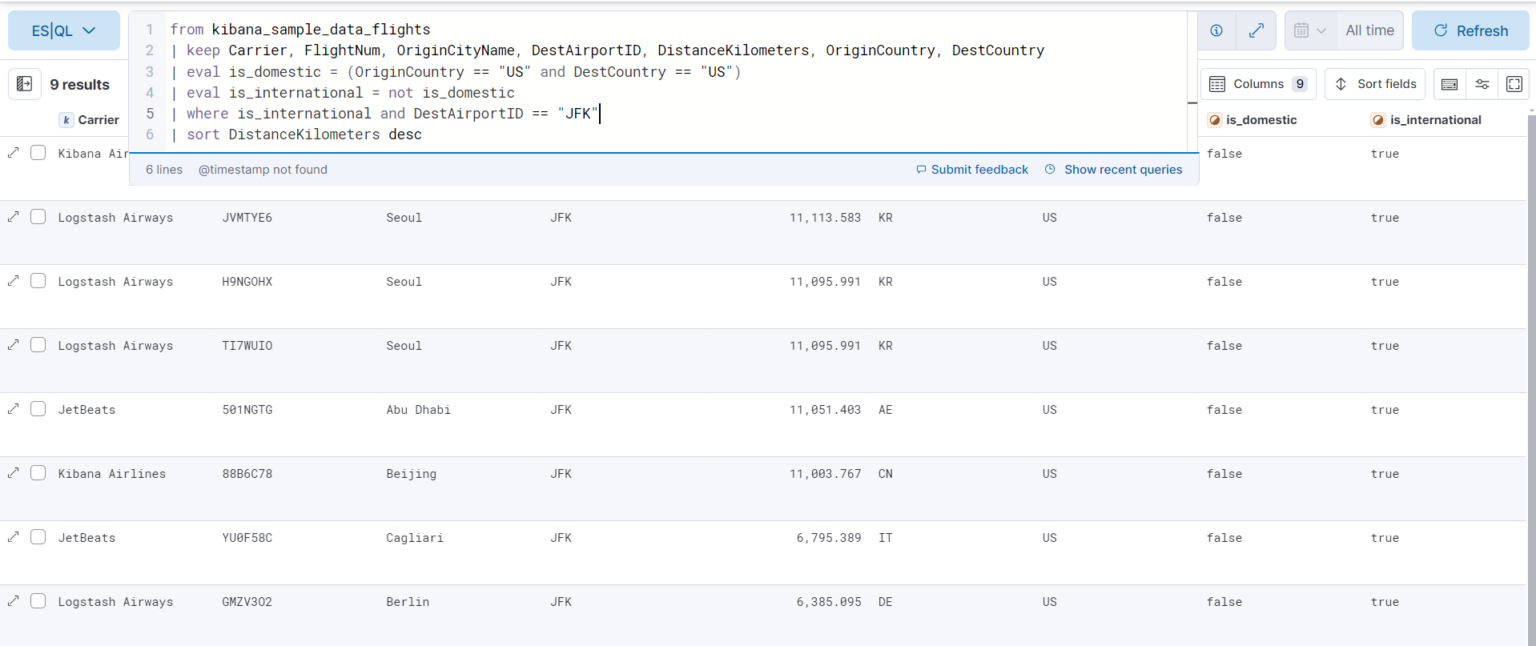
2) Which was the longest international flight (assume you live in the States)
from kibana_sample_data_flights
| Keep Carrier, FlightNum, OriginCityName, DestAirportID, DistanceKilometers, OriginCountry, DestCountry
| eval is_domestic = (OriginCountry == “US” and DestCountry == “US”)
| eval is_international = not is_domestic
| where is_international and DestAirportID == “JFK”
| sort DistanceKilometers desc
This query is written in Elasticsearch Query Language (ESQL) and is designed to retrieve information about the longest international flights from the kibana_sample_data_flights index
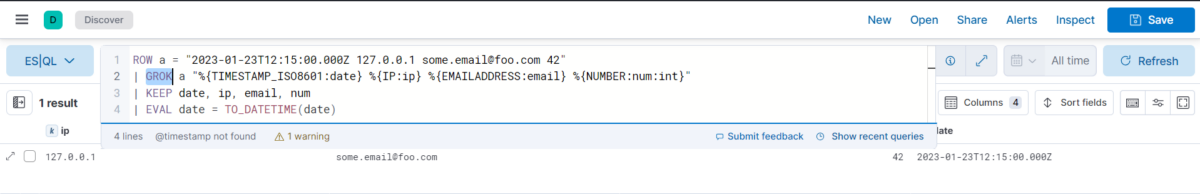
3) Directly apply grok on Discover and analyze the data.
ROW a = “2023-01-23T12:15:00.000Z 127.0.0.1 [email protected] 42”
| GROK a “%{TIMESTAMP_ISO8601:date} %{IP:ip} %{EMAILADDRESS:email} %{NUMBER:num:int}”
| KEEP date, ip, email, num
| EVAL date = TO_DATETIME(date)
This query is written in Elasticsearch Query Language (ESQL) and is designed to retrieve information of grok from the row document
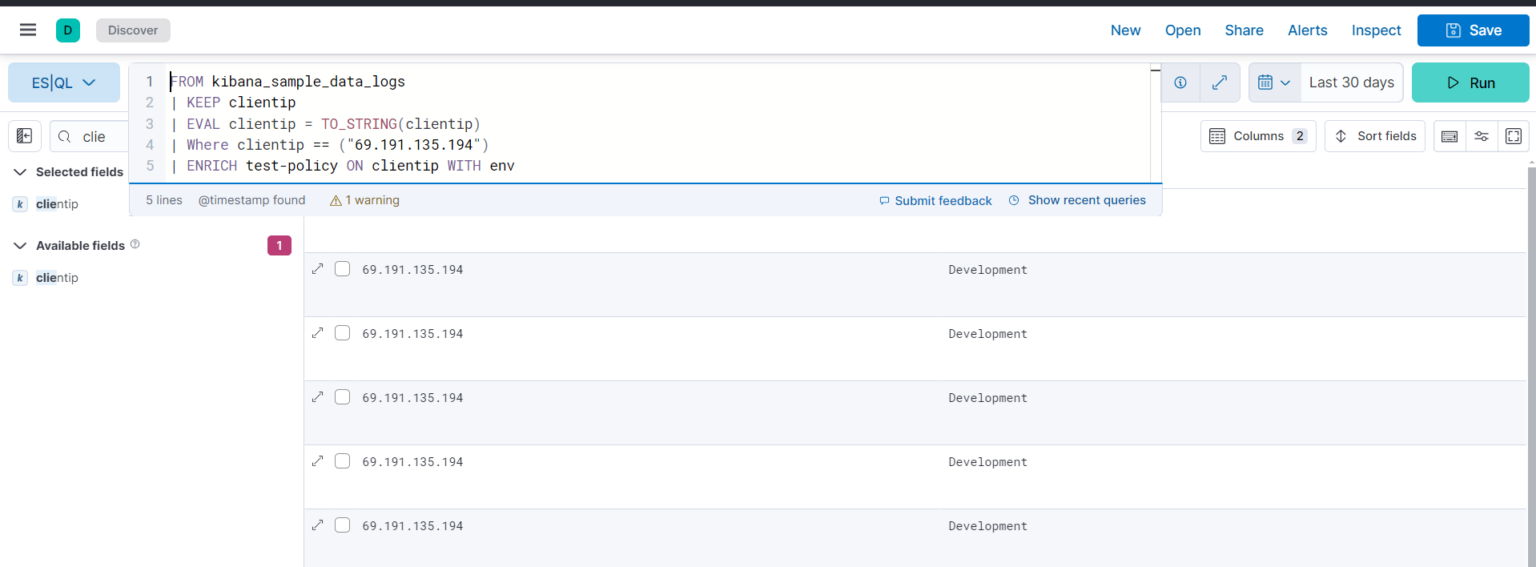
4) Enrich your query data set with fields from another data set
FROM kibana_sample_data_logs
| KEEP clientip
| EVAL clientip = TO_STRING(clientip)
| Where clientip == (“69.191.135.194”)
| ENRICH test-policy ON clientip WITH env
You can use the enrich command (documentation) to enhance your query data set with fields from another data set, complete with in-context suggestions for the selected policy (i.e., hinting the matching field and enriched columns).