Apigee, Google’s native API management platform on the Cloud, enables the building, managing, and securing of APIs for any use case, environment, or scale. Apigee provides high-performance API proxies that create a consistent and reliable interface for backend services. This proxy layer allows granular control over security, rate limiting, quotas, analytics, and more. Supporting REST, gRPC, SOAP, and GraphQL, Apigee offers the flexibility to implement any API architectural style.
Apigee offers an API proxy layer between your backend services and the internal or external clients accessing them. This proxy layer provides a comprehensive set of policies to enhance security, traffic management, data mediation, extensions, and more, delivering a robust, enterprise-grade API management solution. You can incorporate custom code, conditional logic, fault handling, rate limiting, caching, and other features. Since these policies and actions are applied within Apigee’s API proxy layer, your underlying backend services remain unaffected.
Apigee writes its logs to a specified file path on the machine. We need to read these logs from the file and ingest them into Elasticsearch. There are multiple ways to push logs into Elasticsearch, using shippers such as Elastic Agent, Logstash, or Filebeat.
We are using Elastic Agent for this purpose, which requires an integration to read the logs (such as a custom log integration) and push them into Elasticsearch. After reading and ingesting the logs, we need to parse the raw logs. Once we have a sample of the logs, we can create an ingest pipeline and develop custom parsing ingest pipeline processors to parse the logs.
The integration provides a default ingest pipeline that we need to modify by writing our custom parsing patterns and saving them. As a result, new logs will be ingested into Elasticsearch after being parsed.
Integrating Apigee with Elasticsearch using the Elastic Agent enhances API monitoring by delivering real-time insights and advanced analytics. The Elastic Agent streamlines the collection, transformation, and shipping of logs and metrics from Apigee to Elasticsearch.
Steps to Fetched Apigee Logs with Elasticsearch Agent
Step 1 Enroll elastic agent in Elasticsearch

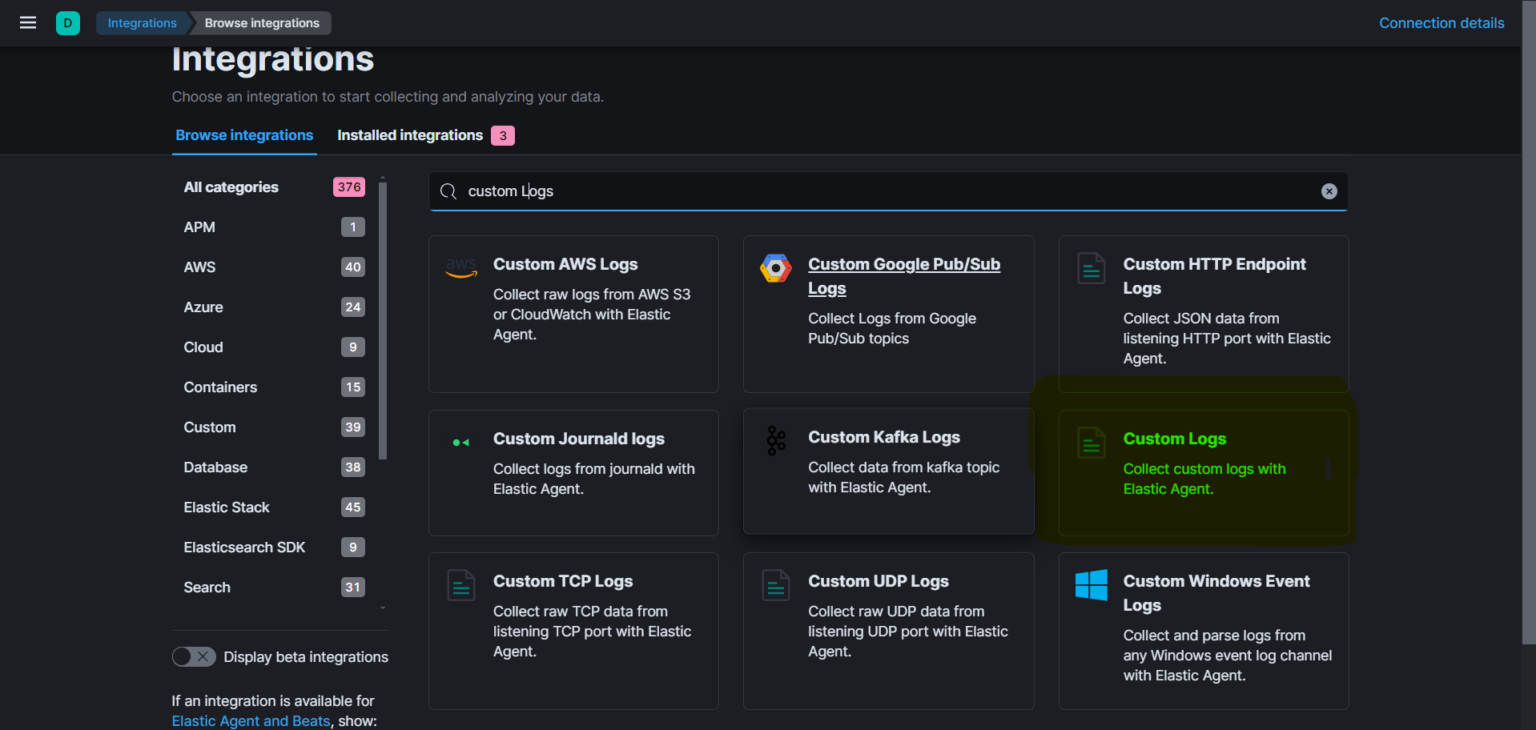
Step 2 Add integration of custom logs
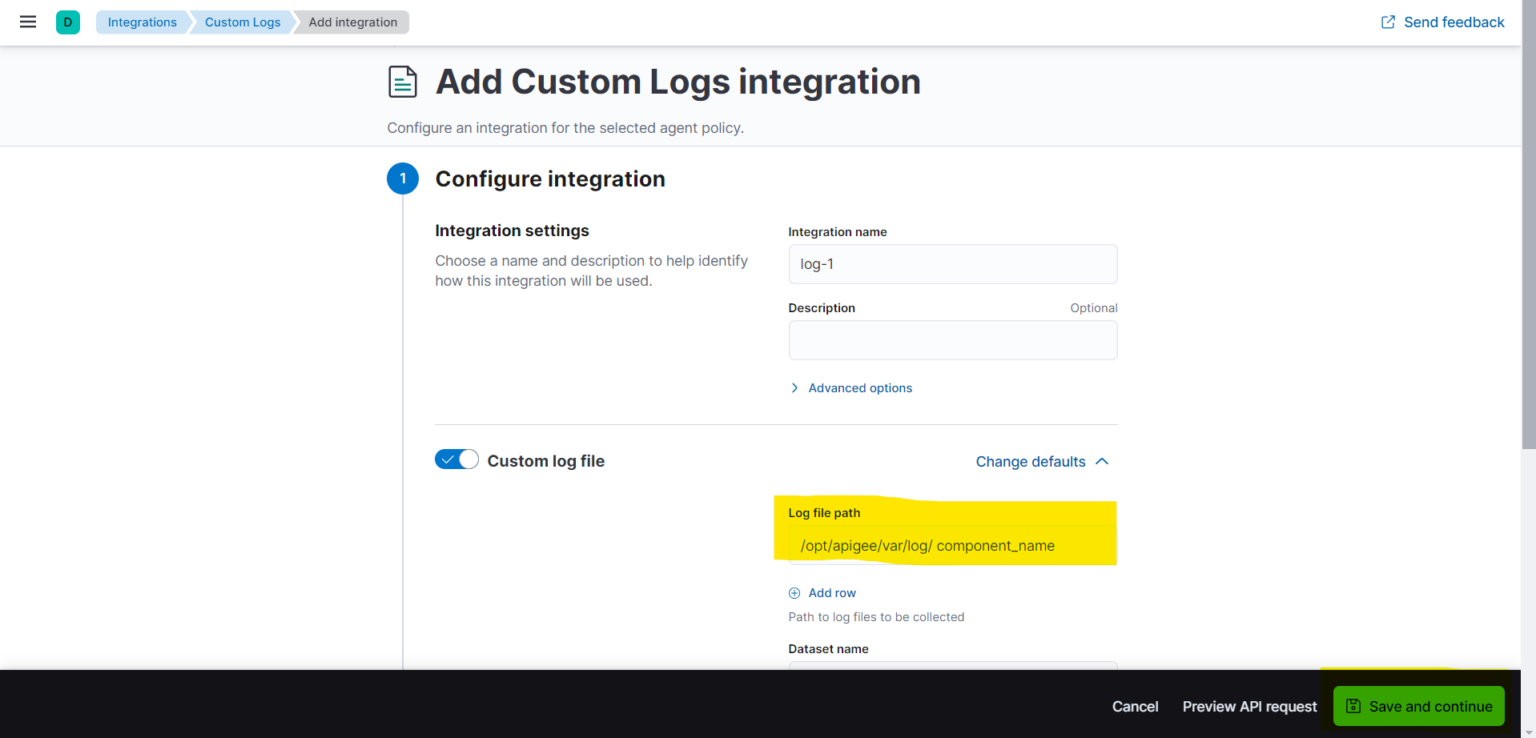
Step 3 Add the path of the Apigee logs file and click on save and continue (we can also add multiple paths for multiple logs file).
Now the Apigee logs are forwarded to elastic agent
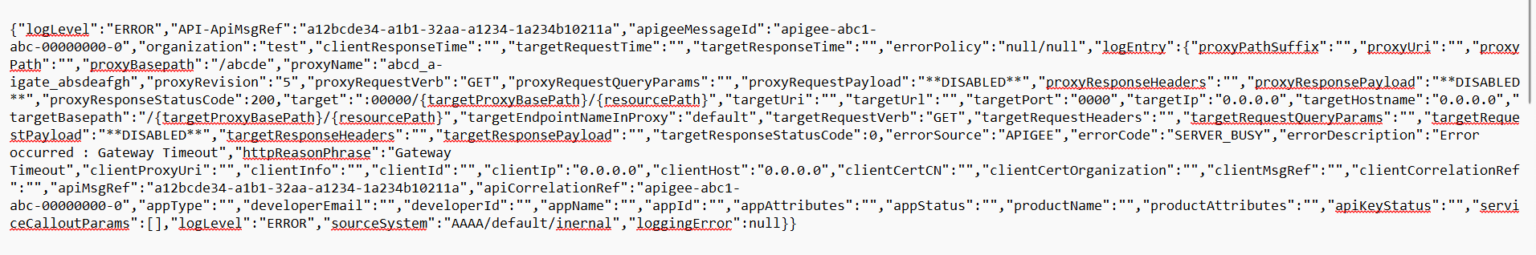
Step 4 Verify the logs from discover or index management.
We can parse the fields according to our needs using the ingest pipeline feature. Following is an example of an ingest pipeline
{
“description”: “For Parsing the apigee logs”,
“processors”: [
{
“json”: {
“field”: “message”,
“target_field”: “json”,
“ignore_failure”: false,
“tag”: “json_parse”,
“on_failure”: [
{
“gsub”: {
“field”: “message”,
“pattern”: “””\[object Object\]”””,
“replacement”: “null”,
“ignore_failure”: true
}
},
{
“json”: {
“field”: “message”,
“target_field”: “json”,
“ignore_failure”: true
}
}
]
}
},
{
“set”: {
“field”: “event.start”,
“copy_from”: “@timestamp”,
“ignore_failure”: true
}
},
{
“set”: {
“field”: “timeline.totalDuration”,
“copy_from”: “event.duration”,
“ignore_failure”: true
}
},
{
“convert”: {
“field”: “json.targetResponseTime”,
“type”: “long”,
“ignore_failure”: true
}
},
{
“rename”: {
“field”: “json.logEntry”,
“target_field”: “logEntry”,
“ignore_missing”: true,
“ignore_failure”: true
}
},
{
“json”: {
“field”: “logEntry.proxyResponseHeaders”,
“target_field”: “proxy.responseHeadersParsed”,
“ignore_failure”: true
}
},
{
“set”: {
“field”: “log.level”,
“copy_from”: “json.logLevel”,
“ignore_failure”: true
}
},
{
“rename”: {
“field”: “logEntry.proxyResponsePayload”,
“target_field”: “proxy.response.payload”,
“ignore_failure”: true
}
},
{
“remove”: {
“field”: “logEntry.targetResponsePayload”,
“ignore_failure”: true,
“if”: “ctx.logEntry?.targetResponsePayload == ””
}
},
{
“remove”: {
“field”: “logEntry.targetRequestVerb”,
“ignore_failure”: true,
“if”: “ctx.logEntry?.targetRequestVerb == ””
}
},
{
“remove”: {
“field”: “logEntry.targetRequestQueryParams”,
“ignore_failure”: true,
“if”: “ctx.logEntry?.targetRequestQueryParams == ””
}
},
{
“remove”: {
“field”: “logEntry.clientCertCN”,
“ignore_failure”: true,
“if”: “ctx.logEntry?.clientCertCN == ””
}
},
{
“remove”: {
“field”: “logEntry.errorSource”,
“ignore_failure”: true,
“if”: “ctx.logEntry?.errorSource == ””
}
},
{
“remove”: {
“field”: “logEntry.proxyRequestQueryParams”,
“ignore_failure”: true,
“if”: “ctx.logEntry?.proxyRequestQueryParams == ””
}
},
{
“remove”: {
“field”: “logEntry.targetBasepath”,
“ignore_failure”: true,
“if”: “ctx.logEntry?.targetBasepath == ””
}
},
{
“remove”: {
“field”: “logEntry.targetEndpointNameInProxy”,
“ignore_failure”: true,
“if”: “ctx.logEntry?.targetEndpointNameInProxy == ””
}
}
],
“on_failure”: [
{
“set”: {
“description”: “Record error information”,
“field”: “error.message”,
“value”: “Processor {{ _ingest.on_failure_processor_type }} with tag {{ _ingest.on_failure_processor_tag }} in pipeline {{ _ingest.on_failure_pipeline }} failed with message {{ _ingest.on_failure_message }}”
}
}
]
}
Step 5 You can use this data for custom visualization as per requirements.
Conclusion
Integrating Apigee with Elasticsearch using the Elastic Agent provides a robust solution for real-time API monitoring and analysis. It enhances your ability to monitor and analyze API traffic. By exporting Apigee logs to Elasticsearch, you can leverage powerful search, analytics, and visualization tools to gain deeper insights into your API operations. This setup enables proactive monitoring, quick troubleshooting, and data-driven decision-making. Implement this integration to take your API monitoring to the next level and ensure the reliability and performance of your APIs.